Orbisa Securities Lending
Instructions
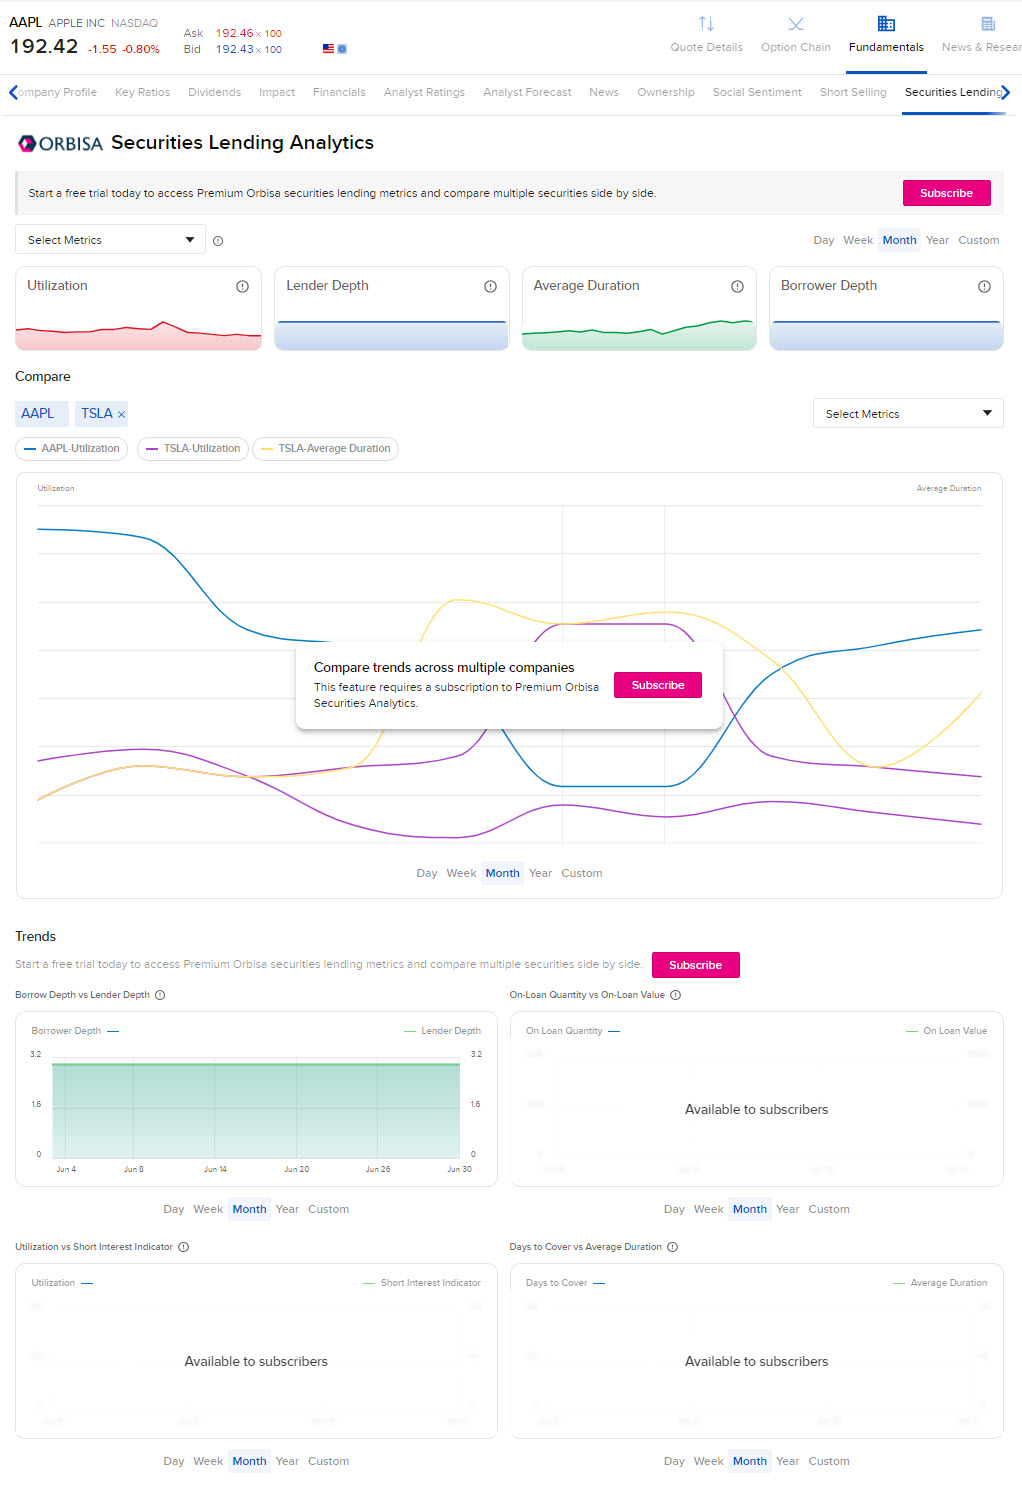
The Orbisa Securities Lending data is now available to all Interactive Brokers clients. Users signed up to Premium Orbisa Securities Lending Analytics also have access to 12 months of historical data. With this level of historical data, users can see when borrowing demand is increasing or decreasing to better gauge which direction market sentiment is trending. The Premium version also allows users to compare securities lending trends across multiple securities to understand borrowing demand between two names they may be analyzing.
To navigate to this page, please take the steps outlined below.
-
Click Menu in the top left corner > Research > Fundamentals Explorer.
-
Enter a ticker symbol into the search field and select the product.
-
Select the Securities Lending tab

-
Select the time frame in the top right corner (Week, Month, Year, or Custom)
-
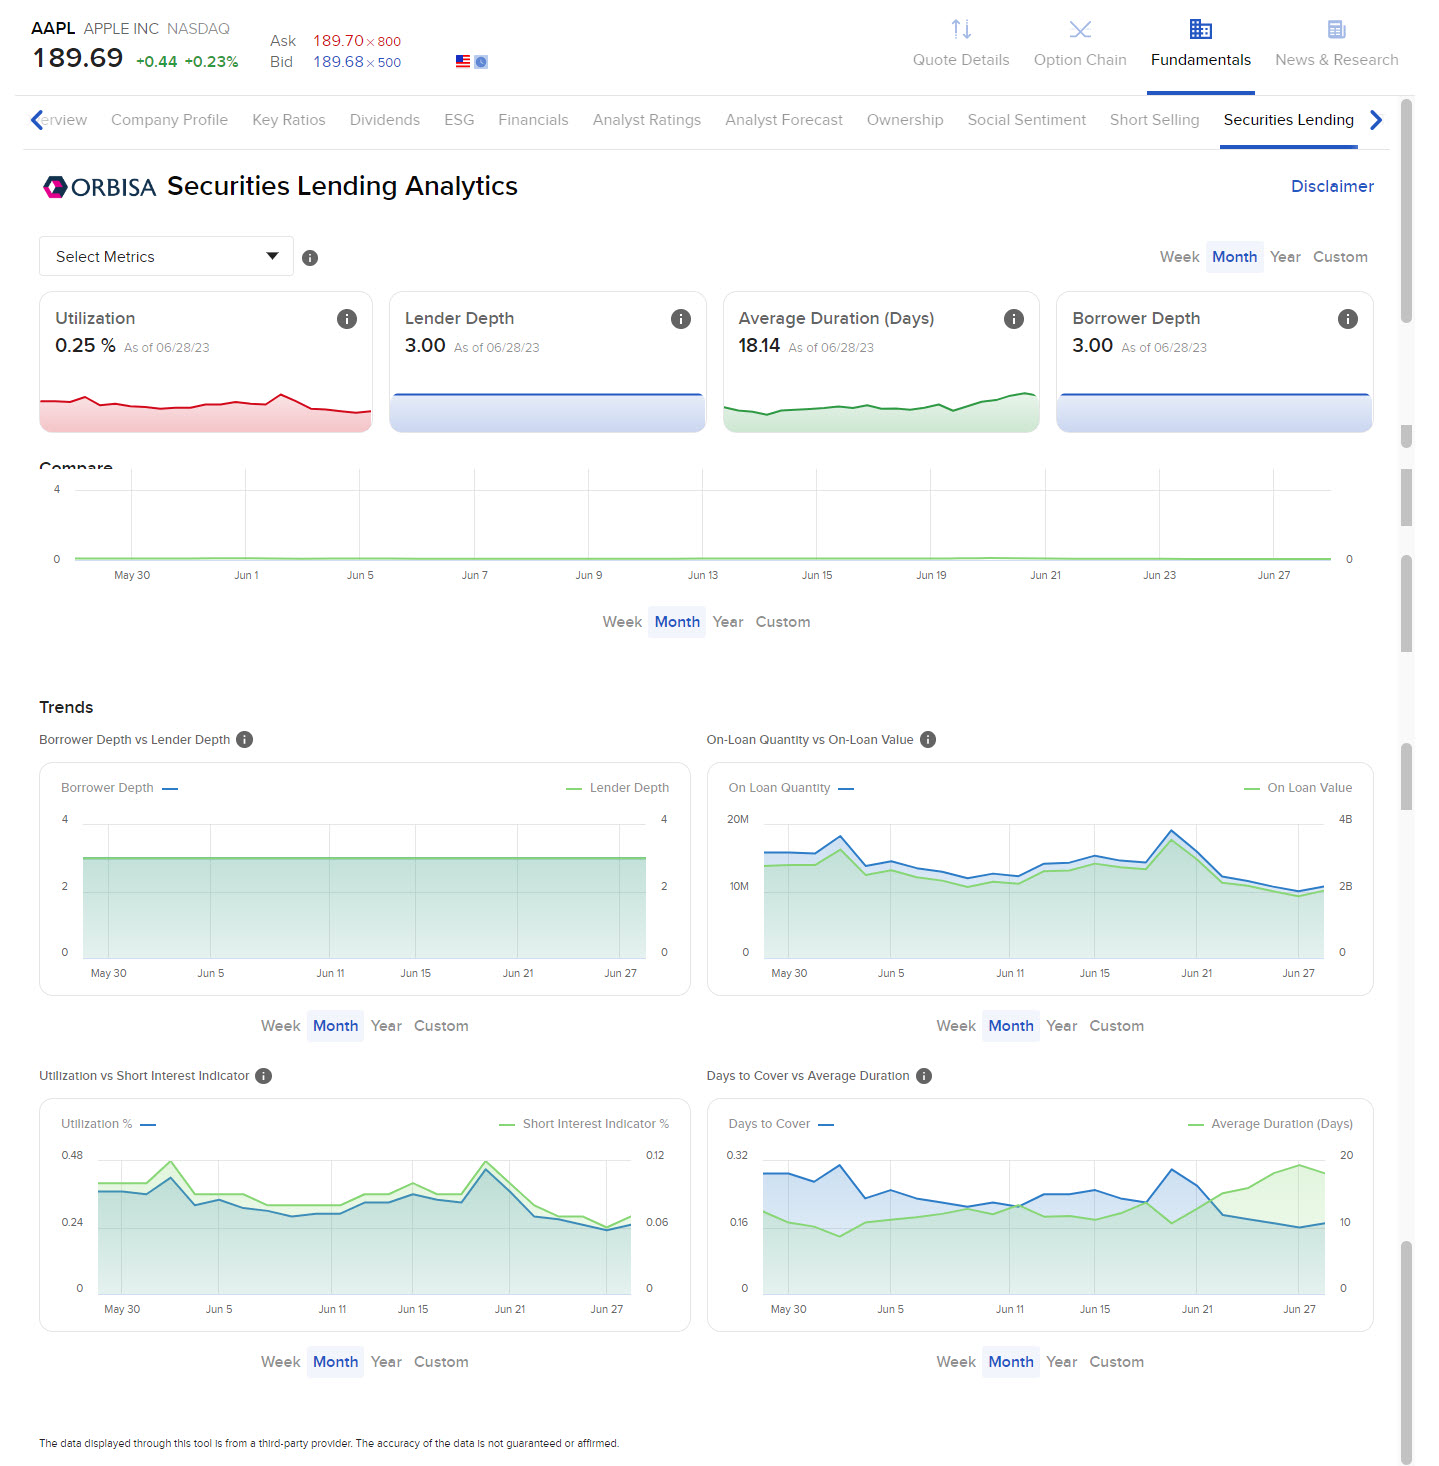
You may select up to 4 Metrics to view across the top of the page. These have been listed below
-
Average Duration (Days): The volume weighted average duration of all open loans in the security based on Trade Date, expressed in calendar days.
-
Borrower Depth: A scale to indicate the number of borrowers with an outstanding borrow in the name. 1: 0-5 borrowers, 2: 6-10 borrowers, 3: 11 or more borrowers.
-
Days to Cover: For equity securities, the number of shares on loan in the security for the business date divided by the 30-day average trading volume in the cash market.
-
Lender Depth: A scale to indicate the number of lenders with an outstanding borrow in the name. 1: 0-5 lenders, 2: 6-10 lenders, 3: 11 or more lenders.
-
On Loan Quantity: Total quantity of the security on loan.
-
On Loan Value: Total value (USD) of the security on loan.
-
Short Interest Indicator: For equity securities, the number of shares on loan divided by the total number of shares in the public float, expressed as a percentage. For fixed income securities, the size on loan divided by the issuance size, expressed as a percentage.
-
Utilization: Total quantity of the security on loan divided by the total inventory of the security. Expressed as percentage.
-
-
To add ticker symbols to the chart which allows users to select 2 tickers and compare short-selling data, select the Subscribe button.
-
Scroll down to the Trend section to view Borrow Depth vs Lender Depth. To view the other trends, please select the Subscribe button.
-
Click Menu in the top left corner > Research > Fundamentals Explorer.
-
Enter a ticker symbol into the search field and select the product.
-
Select the Securities Lending tab

-
Select the time frame in the top right corner (Week, Month, Year, or Custom)
-
You may select up to 4 Metrics to view across the top of the page. These have been listed below
-
Average Duration (Days): The volume weighted average duration of all open loans in the security based on Trade Date, expressed in calendar days.
-
Borrower Depth: A scale to indicate the number of borrowers with an outstanding borrow in the name. 1: 0-5 borrowers, 2: 6-10 borrowers, 3: 11 or more borrowers.
-
Days to Cover: For equity securities, the number of shares on loan in the security for the business date divided by the 30-day average trading volume in the cash market.
-
Lender Depth: A scale to indicate the number of lenders with an outstanding borrow in the name. 1: 0-5 lenders, 2: 6-10 lenders, 3: 11 or more lenders.
-
On Loan Quantity: Total quantity of the security on loan.
-
On Loan Value: Total value (USD) of the security on loan.
-
Short Interest Indicator: For equity securities, the number of shares on loan divided by the total number of shares in the public float, expressed as a percentage. For fixed income securities, the size on loan divided by the issuance size, expressed as a percentage.
-
Utilization: Total quantity of the security on loan divided by the total inventory of the security. Expressed as percentage.
-
-
Select the + button below Compare which allows users to select 2 tickers and compare short-selling data.
-
Select the Metrics to view on the chart in the top right corner.
-
Scroll down to the Trend section to view the following:
-
Borrow Depth vs Lender Depth
-
On Loan Quantity vs On Loan Value
-
Utilization vs Short Interest Indicator
-
Days to Cover vs Average Duration
-
-
Select your time period for each Trend section.
Note: The paid version costs $12.99 and can be access through a free 30-day trial.
Note: The Securities Lending Dashboard is accessible on Client Portal, TWS, IBKR Mobile, and IBKR Desktop.