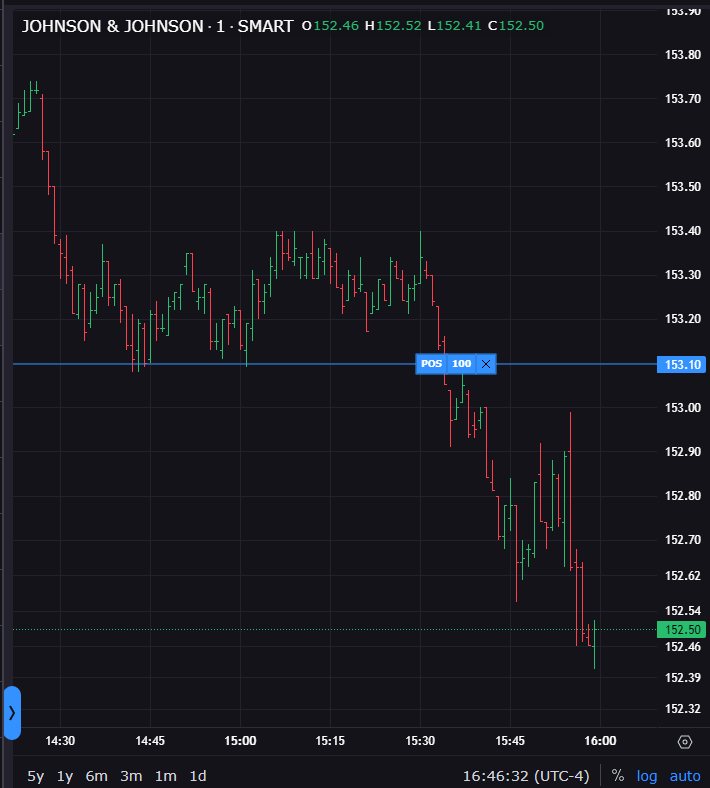
Can I see the position and average price on my chart?
Instructions
Yes, With release of version 0.08 in April of 2024, by default you will now see the position and average price on your chart. Display will be blue for long positions and red for short. The current price is always green.
Note that if the current price and average price of your position are far apart, you may need to adjust the price scale to see both. To do this, hover your mouse at the top of the Y-axis until the cursor becomes two arrows. Click and hold, then drag the price line down until the current price and average price are close enough to see both on the chart.
To disable this feature, click the gear icon to open Chart Settings, and from the Trading menu uncheck "Positions."

Additional Resources
Learn About Creating, Viewing, Modifying Orders in Charts at IBKR Campus