Historical Volatility
The Historical Volatility Window displays the historical volatility for a stock dependent on a specified time frame. To navigate to this graph, please take the steps outlined below.
Instructions
-
From the left-side panel click the Quote
 icon.
icon. -
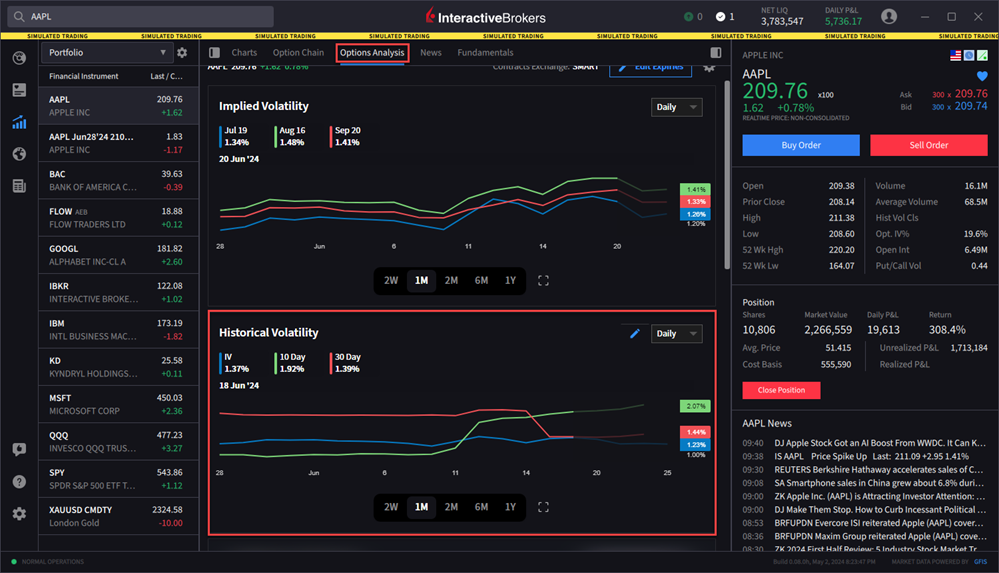
Click the Option Analysis tab along the top of the Quote page.
-
Scroll down to view the Volatility window.

-
Hover your curser over the graph to view the historical volatility percentages. The percentage will populate in the top left corner of the window, followed by the expiry date.
-
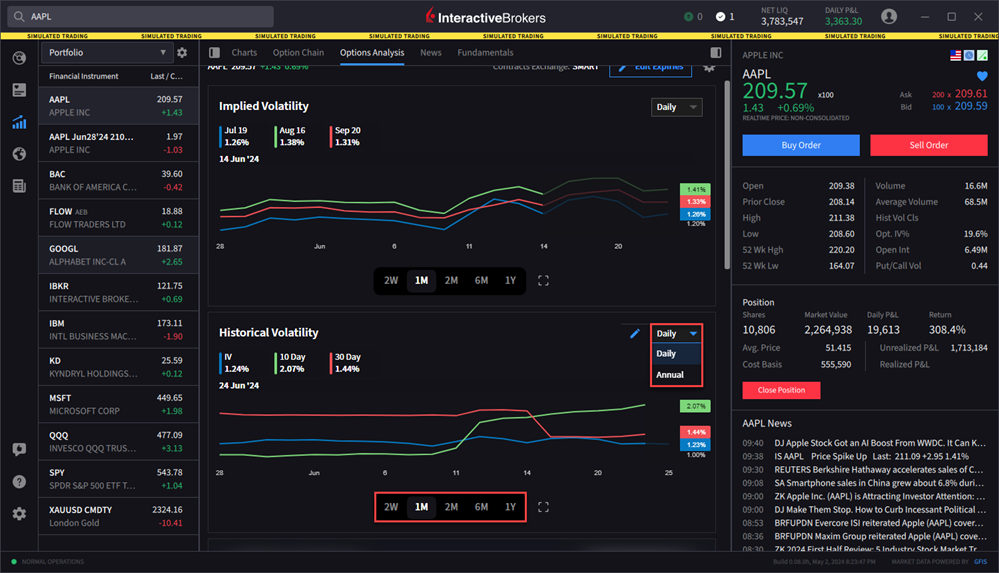
Change the time period by selecting the buttons at the bottom of the graph. You may also select the drop-down menu in the top right corner of the graph to switch from Daily to Annual.

-
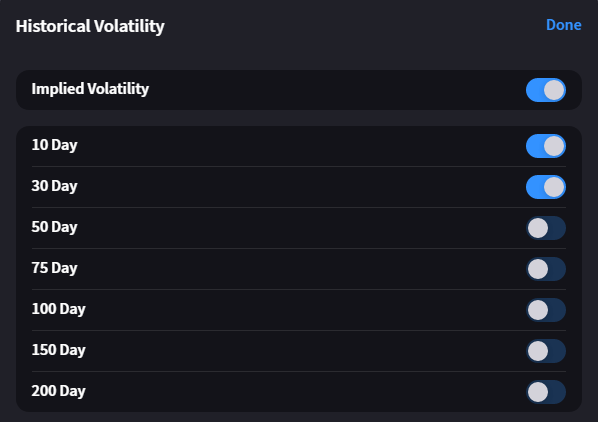
Edit the number of days by selecting the pencil
 icon in the top right corner.