Implied Volatility
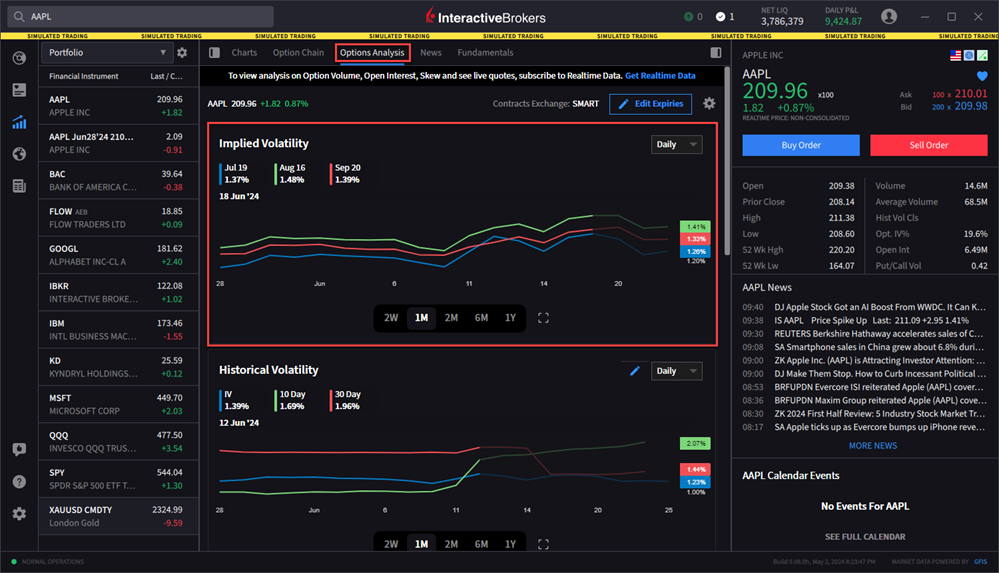
The Implied Volatility window displays the measure of anticipated volatility of the stock using the prevailing option premium. To navigate to this graph, please take the steps outlined below.
Instructions
-
From the left-side panel click the Quote
 icon.
icon. -
Click the Option Analysis tab along the top of the Quote page.
-
The Implied Volatility window will populate at the top of the page

-
Hover your curser over the graph to view the implied volatility percentage. The percentage will populate in the top left corner of the window, followed by the expiry date.
-
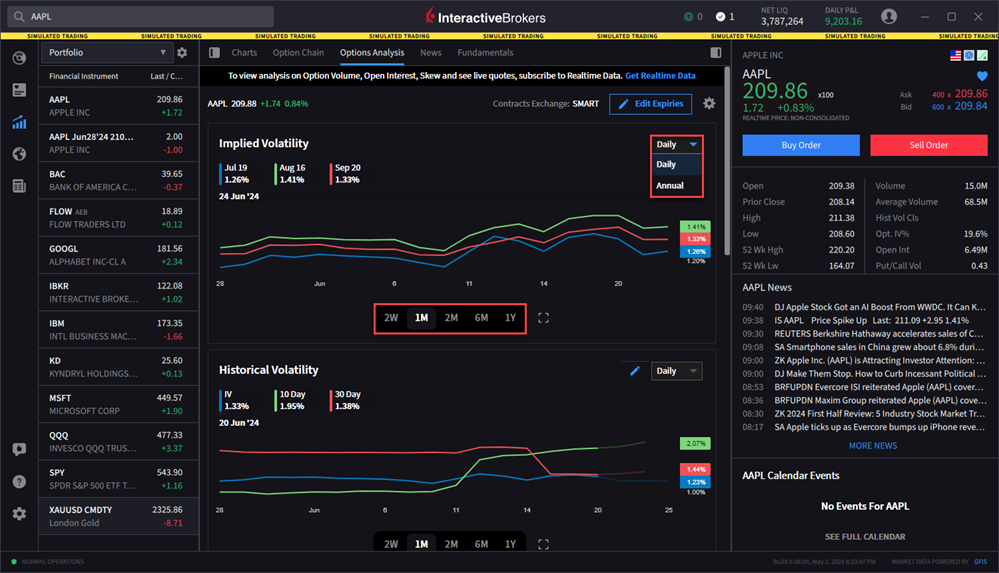
Change the time period by selecting the buttons at the bottom of the graph. You may also select the drop-down menu in the top right corner of the graph to switch from Daily to Annual.

-
Edit the expires shown on the graph by clicking the Edit Expiries button at the top of the window.
