Exposure Fee Calculation Reports
Introduction
Our Portals system lets you configure and manage your account from a single window, including our Exposure Fee Calculations report. The Exposure Fee Calculations is generated daily and made available within Portals prior to the U.S. equity market open. This report allows users to view the change in Profit and Loss (PnL) of your positions if the price of each of your positions declines and increases by predetermined percentages.
Report Access
To access/generate an Exposure Fee Calculations Report
-
From the Portals Home Page, click on the Performance & Reports tab and then select Other Reports
Alternatively, select the Menu button in the top left corner followed by selecting Reporting and then choosing Other Reports
-
The Other Reports screen will populate where you will see the option for the Exposure Fee Calculations.
-
Select the blue arrow run icon to the right of Exposure Fee Calculations.
-
A pop-up will appear on your screen where you will enter the Date and Language for this Report.
-
Press Run to view the report.
Report Overview
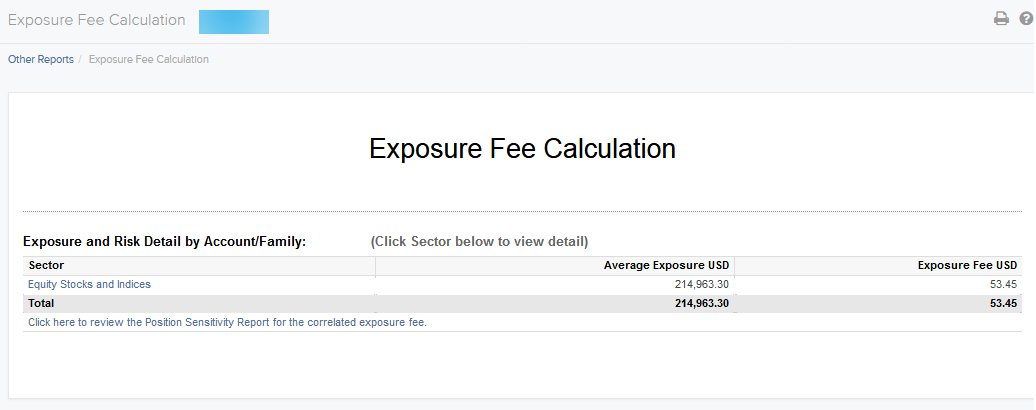
The Exposure Fee Summary Reports reflects the Average Exposure and the corresponding Exposure Fee for each Sector1 and a hyper-link to view our Sensitivity Report for the Correlated Exposure Fee.

Detailed Sector Summary
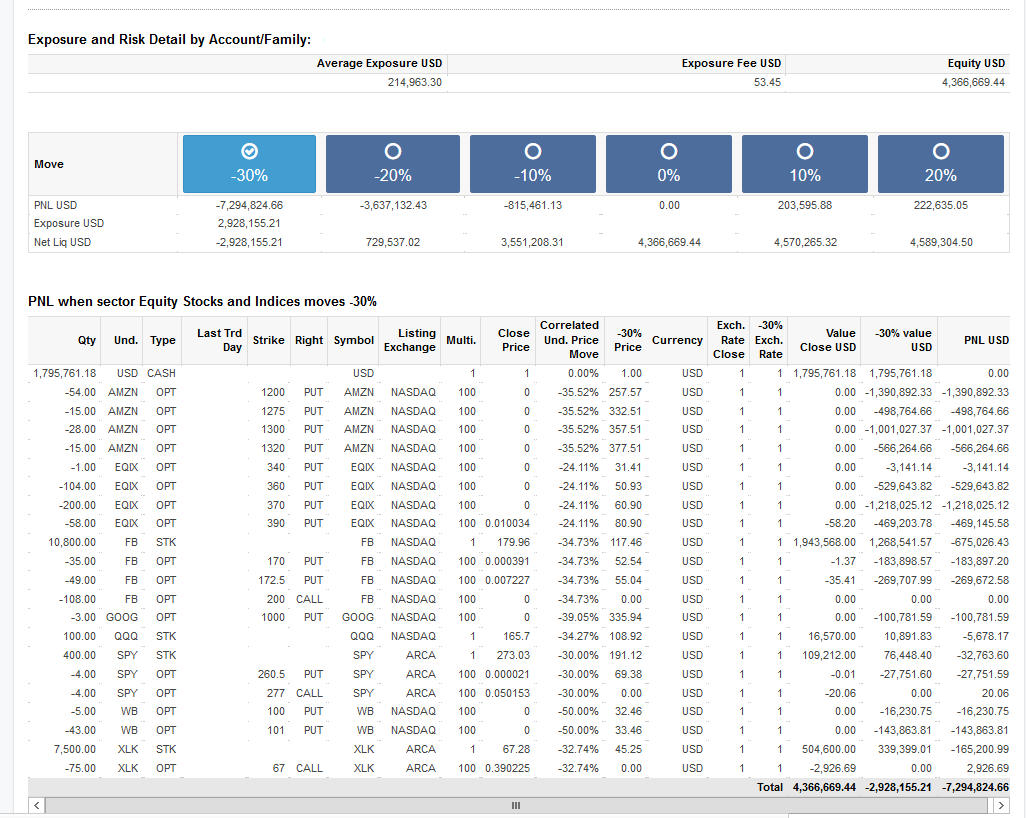
Clicking on the hyper-link associated with each sector1 will populate a detailed summary, which allows users to see the change in the PNL of your positions if the price of the corresponding ETF/Index increases / declines by a pre-determined amount. For the example of Equity Stocks and Indices we are assuming SPX declines by 30%, 20% and 10% and independent increases by 10% and 20% The results are based on theoretical pricing models and take into account coincidental changes in volatility and other variables that affect derivative prices
The report shows:
-
The Net Liquidation Value (NLV) of your account based on positions from the previous day’s close
-
Average Exposure for the sector
-
Corresponding Exposure Fee
-
Equity of all positions in the account with PNL in base currency
To use the report, click the radio button that corresponds to the up or down price change you want to see (+/- 10%, 20% or +30%). The PNL for each position is updated by the selected percentage
The following are figure shows an example of a Detailed Summary of the Equity Sector, with -30% selected

1 Accounts may have Average Exposure and a corresponded Exposure Fee for more than 1 Sector.
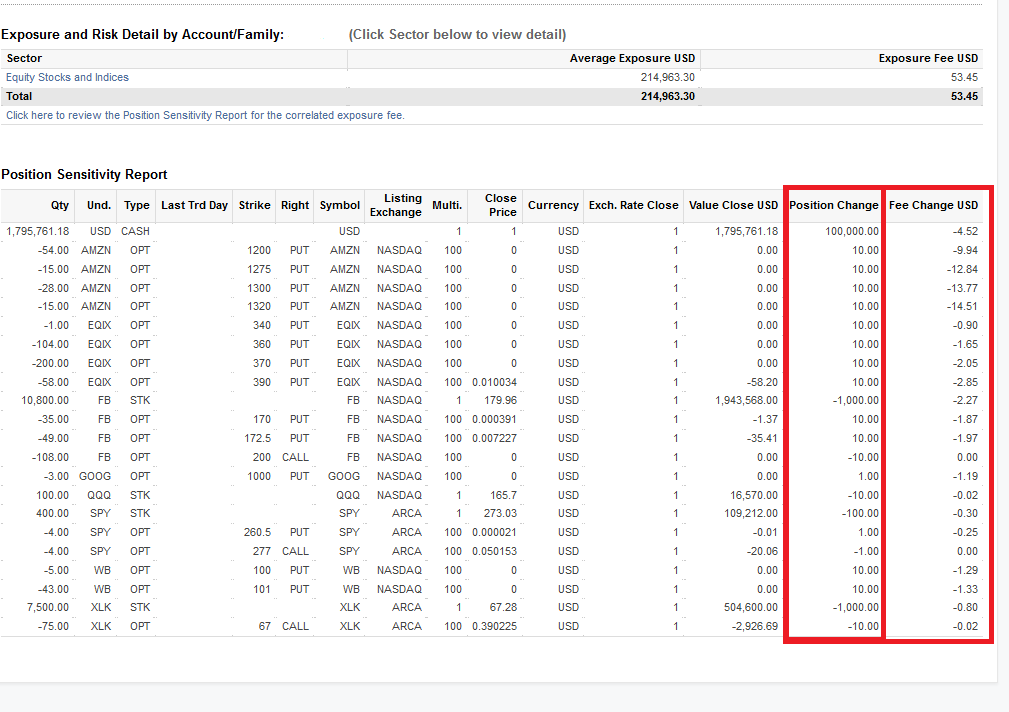
Sensitivity Report for the Correlated Exposure Fee
For every contract in the portfolio we compute an estimate of the exposure fee if the position of a single contract is modified. We assume that contracts are bought or sold, as opposed to transferred in/out. The position change is not editable and in some cases may actually require the account to reverse the direction of their position, for example from a short position to long position.

For additional information regarding the Exposure Fee, please see Exposure Fee Calculations Overview.