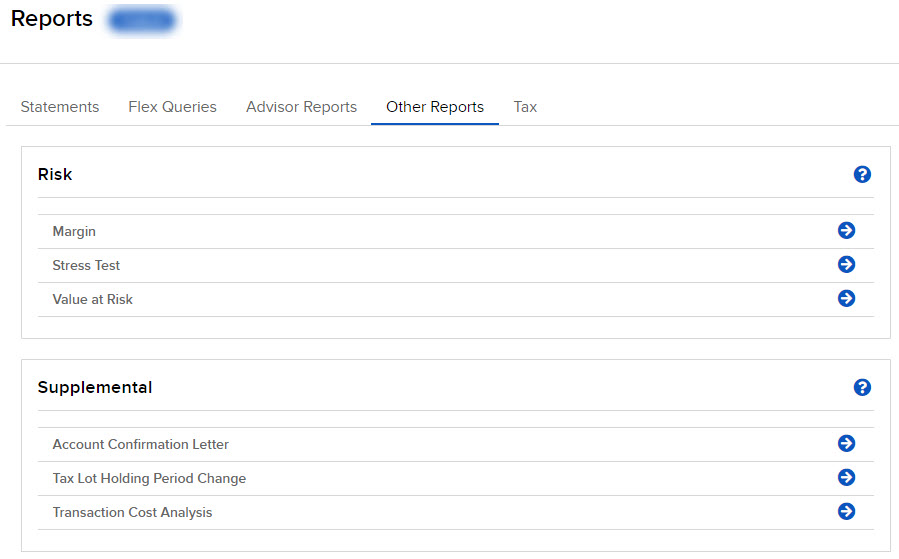
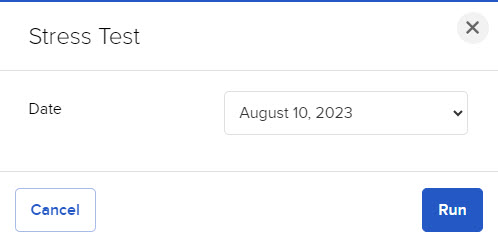
The Stress Test Summary report lets you see the change in the PNL of your positions if the underlying price of each of your positions declines by 3%, 5%, 10%, 20% and 30% and independently increases by 3%, 5%, 10%, 20% and 30%. The results are based on theoretical pricing models and do not take into account coincidental changes in volatility or other variables that affect derivative prices.
The report shows:
- The Net Liquidation Value (NLV) of your account on the close, in USD.
- The cash balance of your account, in USD.
- Equity of all stock and derivatives, equity index derivatives and mutual funds, with P&L (displayed as “PNL” in the report) in USD.
To use the report, click the radio button that corresponds to the up or down price change you want to see (+/- 3, 5, 10, 20 or 30%). The PNL for each position is updated by the selected percentage.
Certain positions are shown in the report but not valued under the stress scenarios of -30%/+30% changes in the underlying price. You must evaluate your own risk for these positions and include them in the totals provided.

