Chart / Advanced Chart
Instructions
You can modify chart parameters from within the quote details page to display a real-time or bar chart for all supported contracts.

-
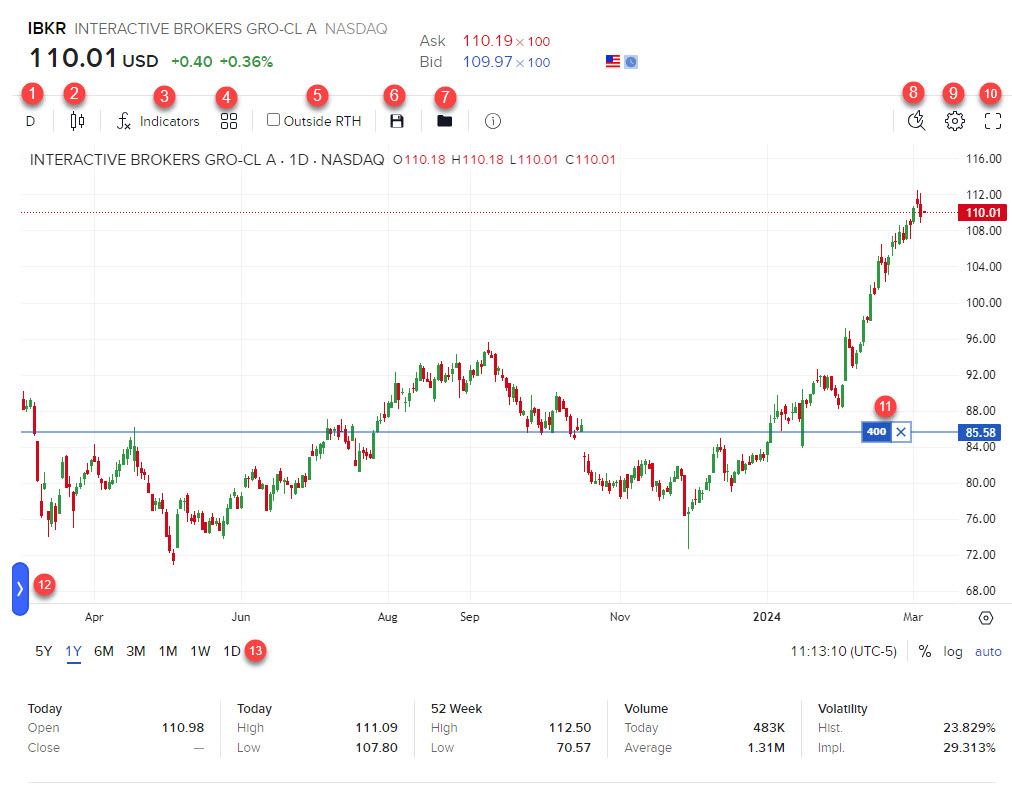
Time Period - Quickly change or create new Time Period charts from the chart dashboard.
-
Candles - Choose the type of bar, either Bars, Candles, Hollow Candles, Lines, Line with Markers, Step Line, Area, HLC Area, Baseline, Columns, High-Low, , Heikin Ashi, or Renko.
-
Chart Indicators - A type of technical indicator that charts a series of data points derived from applying a formula to the price data of a security. For more information, see the TWS Users’ Guide.
-
Save Indicator Template - Lets you save chart indicators to your account.
-
Outside RTH - Checking the box lets you fill orders outside regular trading hours.
-
Save Chart Snapshot - Lets you save a snapshot of your chart.
-
Load Chart Snapshot - Load saved chart snapshots.
-
Quick Search - Search for drawings, functions, and settings.
-
Chart Settings - Configure your chart settings.
-
Full Screen Mode - View a chart in full screen.
-
Position Line - View your current position, and click the x icon to close it.
-
Show Drawings Toolbar - Drawing tools are concealed behind a blue arrow along the lower left edge of the chart. Click on the blue arrow to expand the drawing tools panel and select an icon to use a drawing tool.
-
Change Time Display - Change the time period displayed from the chart's lower left by clicking on the desired time period buttons.