Trader Workstation Archived Release Notes
2019
Build 978 - October 2019
With the release of IBKR Lite, all clients will have access to streaming, real-time, non-consolidated market data for US stocks with CBOE ONE for free. TWS version 978 contains changes to support this feed.
Introducing Broker (iBroker) master users who offer commission-free trading to their clients can use TWS 978 and higher to manage client accounts and orders. Any order placed in TWS 978 and higher will route to the commission-free ZERO destination.
Additionally, TWS now includes fields for manual order route and cancel times (when applicable) for institutional users who are required to report such information under FINRA Rule 7440.
An issue with Start and End times for orders related to a Daylight Savings time zone issue has been fixed.
Build 977 - September 2019
Whether it's been two days or two weeks since you last logged in, For You Notifications get you up to speed quickly by sorting through changes then debriefing you on the most important events and updates in your account since your last login. See filled orders and open orders that might benefit from your attention, dividends collected and the top contributing stocks, interest earned and important options activity, to name just a few. For each listed event, tap More to get additional details and dive deeper, with related tools put right at your fingertips.
Available across all platforms, For You Notifications are custom-generated for your account, then filtered and weighted to ensure that only the most potentially impactful events make the list.
Many columns in your TWS Portfolio now support "continuous sorting." This feature automatically re-sorts positions in your Portfolio when an event occurs in your account that changes values in your portfolio, resulting in the need to re-apply the sort order. For example, if you elect to sort your Portfolio continuously by Position (either ascending or descending), when you buy or sell an asset the sort is automatically reapplied to your portfolio to keep the selected sort order up-to-date.
To enable Continuous Sorting for a supported Portfolio field, right-click the column header, select "Sort By" and then choose from the "Continuous Sort" methods available. Clicking the column again will disable Continuous Sort but will allow you to toggle through the sort order (ascending, descending and none) for a one-time sort. One-time sort does not update automatically as the Portfolio changes.
Fields that currently support Continuous Sort are:
- Market Value
- % of Market Value
- Daily PnL
- Unrealized PnL
- Realized PnL
- Avg Price
- Position
To add a field to your Portfolio, hold your mouse over an existing column name to show the insert/remove selections. Click Insert Column. Choose from the categories and command list to add a field to the window.
A new flexible series selector lets you easily add, remove or modify what series are shown on the difference plot and how each is calculated with a single click in the displayed configuration panel. Between the Price and the Difference Plot you can see labels for the currently selected difference definitions. Their border colors are the same as their difference series color. TWS updates the default series for the difference plot based on your configuration as you add or remove dates to the price plot or change your configuration.
- You can change the difference series definition by clicking on the label. It will show a small popup where you can select the days (all the series that are selected for the Price Plot). Once you select the days pair it will change the currently selected definition to the new one (unless you selected a pair which is already selected, in this case it will just remove the edited definition)
- You can remove a definition and its series by clicking the X inside the color border.
- You can add a new definition by clicking on the + button and using the same popup as for the editing/changing.
- When you remove a date from the top check boxes it will remove all definitions that contained this date.
- When you select a new date the window will generate the appropriate new definition depending on the configuration
The definitions you specify here will be kept for a newly opened Futures Term Structure window or when you select a new future, even after you log out and restart TWS.
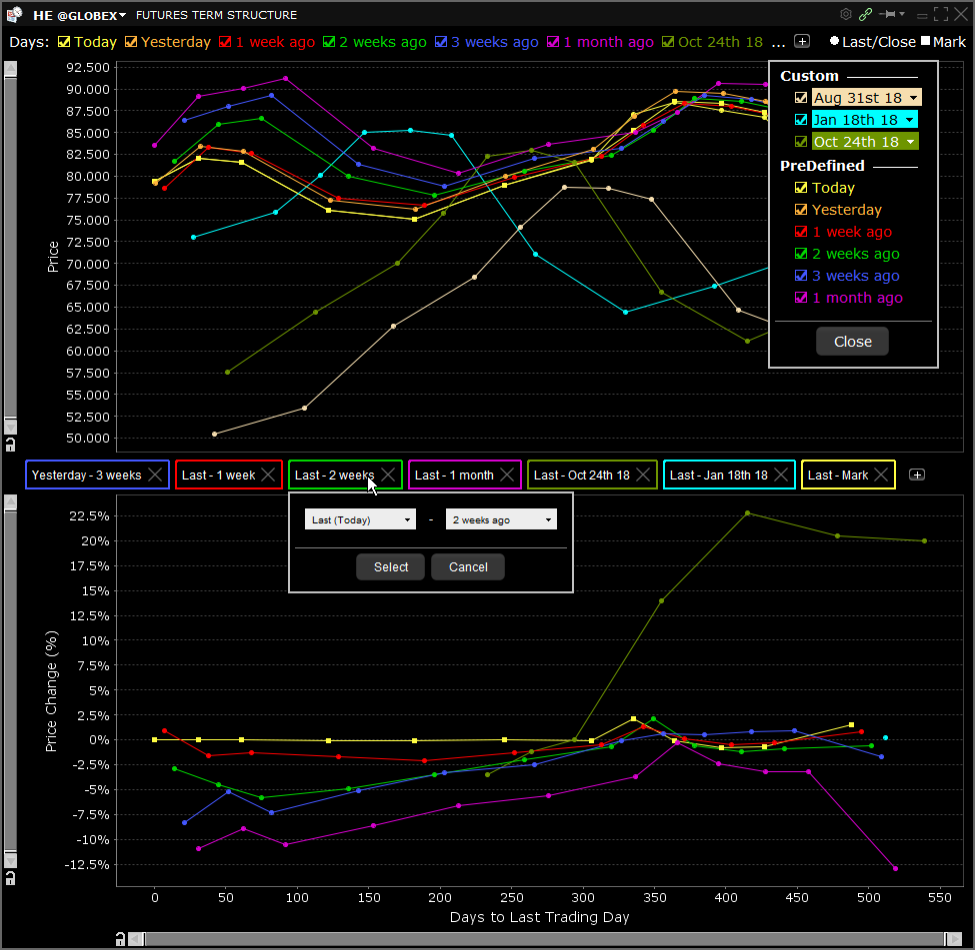
To access the Futures Term Structure tool, select a futures contract and use the right-click menu to select Charts and then Term Structure.
NOTE: If you don't see this selection, use the down arrow to expand the selection list.
We continue to enrich the IBot user experience by offering supplemental articles and information from external sources, like Wikipedia and Investopedia. These third-party additions are clearly marked in IBot's search results.
Coming Soon: We have merged our Watchlist and Scanner functionality into a single tool to make the interface more intuitive. Both features result in a list of financial instruments, with the major difference being the method by which they are compiled. Moving forward, the Watchlist page will include both static Watchlists and dynamic Scanners. And because these lists are saved to the Cloud, you can see the same lists across all your trading platforms.
Watch for this feature to be released soon to IBKR Mobile, Desktop TWS, and Client Portal.
Build 976 - April 2019
The new Watchlist Library provides effortless synchronization of your Watchlists across all platforms, ensuring you get the latest version whether you're logging into mobile, desktop, or Client Portal. There is no need to decide which lists to import or sync, as all of your lists are always available no matter where you are. And we've made it easier than ever for you to get started by offering a library of Watchlists to jump-start your trading. In cases where you've added a product on desktop that isn't yet supported on mobile or Client Portal, it's preserved and displayed correctly in all versions.
When you elect to close all or a portion of positions on multiple assets with either a Limit or Market order, you can now use an algo to manage the close-position orders.
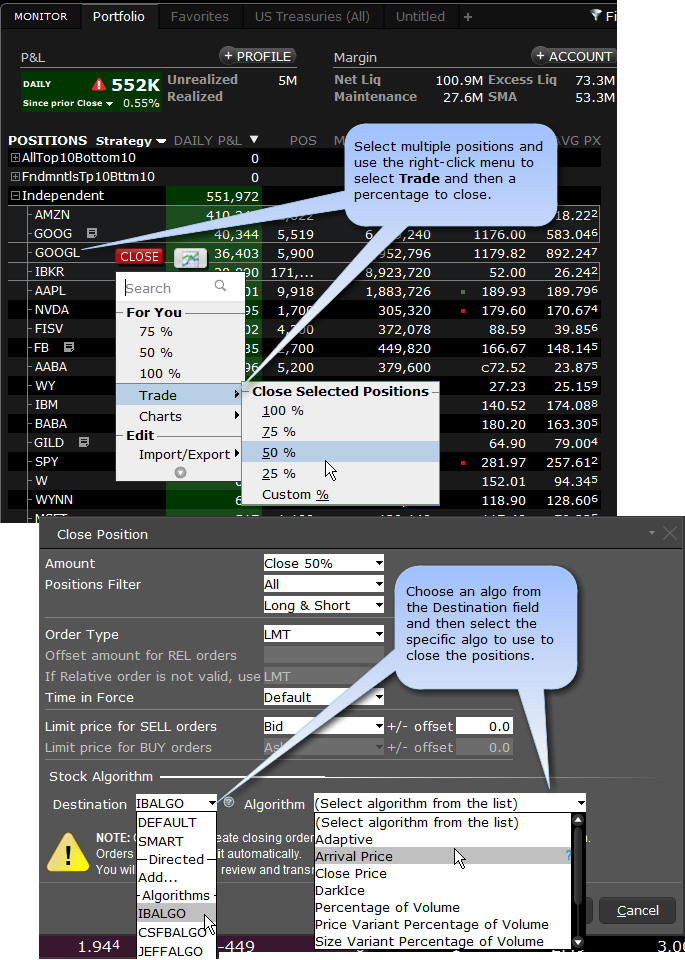
Elect to close multiple positions by selecting positions from your portfolio and using the right-click menu to select Trade, then the percentage of positions to close.
In the Close Positions dialog, complete the fields for closing orders, and choose either LMT or MKT order to enable algos. The context-sensitive Algorithm section presents available algo strategies based on asset type and, when relevant, on the specific instrument. Use the Destination drop-down to choose an algo destination, then use the Algorithm drop-down to choose a specific algo strategy. Complete the order by specifying required values for the chosen algo.
Clients can benefit from lower market data costs by paying only for the quotes they need with Snapshot Market Data requests. These single-use requests provide a real-time quote for a specific product, offering a more cost-effective way for clients to understand where the market is at the time of trade without paying for monthly streaming data subscriptions.
Single-use Snapshot Quotes are automatically enabled; there is no need for any special subscription or sign-up. Clients who don't have a streaming data subscription will see the Snapshot button in Mosaic Order Entry panel when the feature is available (and in the Ticker Action column in Classic Layout). Simply click "Snapshot" to get a live quote that remains visible until you close the window or move to another product. Get an updated quote by clicking Refresh (note that refreshing a quote constitutes another single request for data).
Tracking and Cost Snapshot requests are calculated monthly and the counter is reset each new calendar month. US equities are USD 0.01 (or the equivalent) per quote; all other quotes are USD 0.03 (or the equivalent). All clients receive a USD 3.00 waiver for the first two months, and a USD 1.00 waiver for all subsequent months. If you decide to subscribe to streaming market data at any point, you will only be charged for that month's streaming data subscription and not for any prior snapshot requests.
To learn more see the IB Knowledgebase article.
We recently switched to an improved calibration logic for the bid/ask implied volatility calculation, and to an improved calibrated IV in the 3D Volatility Surface web tool.
We've added several updates to the Futures Term Structure tool:
- We have added the "Today Last Price" series in the term structure plot. This displayed by default. We also now offer the "Today Mark Price" series which is not shown by default but can be selected. Note that historical series are always based on the close price.
- We have added the underlying/index price (when available) as the first node in the series. Optionally, you can also add values markers at the underlying/index price (when available) by selecting "Underlying" in the right-click context menu.
- Now choose to display Price Change or Percentage Price Change (or "return") in the lower section of the window. Use the Config panel from the gear icon to choose.
- We have also added incremental "differences" mode to the difference plot that let's you show both the "difference with respect to 'Last' series" and now "difference with respect to preceding series'.
We have also made minor UI improvements to the IB Risk Navigator display.
Build 975 - February 2019
We are pleased to introduce the MidPrice order type for smart-routed stock orders. MidPrice is designed to split the difference between the bid and ask prices, and fill at the current midpoint of the NBBO - or better. To create this order, simply choose MidPrice from the order entry Order Type field. Set an optional Price Cap to define the highest (for a buy) or lowest (for a sell) acceptable price for the order.
To find out more, see the MidPrice order type page.
In addition to the ESG scores and data points described below, we have added three more ESG pillar scores, added ESG scores in the Advanced Quotes Details window, and included them in the Advanced Market Scanners:
- Three additional ESG scores have been added: Environmental Pillar Score which is a weighted average score of Resource Use, Environmental Innovation and Emissions category scores; Social Pillar Score which is the weighted average of the Workforce, Human Rights, Community and Product Responsibility category scores; and Corporate Governance Score which is the weighted average of the Management, Shareholders and CSR Strategy category scores.
- Advanced Quote Details now displays ESG Scores for over 6,000 companies globally.
- Users can now use Advanced Market Scanners to scan for stocks of companies with the highest or lowest of any of the 16 ESG scores, including the new Environmental, Social and Corporate Governance Pillar Scores.
The Advanced Quote Details window, available when you select an instrument from the Advanced Market Scanner or Bond Scanner, or by clicking More Details from the original Quote Details window, has:
- More data, including Comparison to Historical, Comparison to Peers and Scanner Results.
- Provides a more vibrant, graphical display that's easy to read
- Is context-sensitive to show instrument-relevant data. It will display different information for ETFs than it will for stocks or for bonds.
Additionally, Advanced Quote Details summarizes key data from different TWS tools, then provides a link from that data to launch the relevant tool. For example, view an option and see aggregated Performance Profile data with a link to launch the Probability Lab. View an ETF or Mutual Fund, and see similar ETFs with potentially lower fees, with a link to launch the Mutual Fund/ETF Replicator.
To see the Advanced Quote Details, click More Details from the Quote Details window, or open the Advanced Market or Bond Scanner and select a scan result. Turn off Advanced Quote Details from the Quote Details page in Global Configuration.
In addition to enlarging and reducing the font size across all TWS windows using the font icon in Mosaic, we now include this icon on individual trading windows like Market Depth Trader, BookTrader and other advanced tools. When opened as independent windows, the font size can be changed just for this specific tool, and for all versions of the same tool if desired. For example, if you have 3 Market Depth Trader windows opened on three different instruments and enlarge the font for one, you can have the font size change on all windows by checking the "Adjust window of this type" checkbox in the Font Size Adjustment box.

Note the using the Mosaic font adjuster will apply font changes to all windows. You can also modify the font in the Global Configuration > Settings page for a specific tool.
Increase trading speed by creating custom Market Depth Trader order buttons. Create buttons that are available for all instruments, for a specific asset type, or even for a specific instrument. Buttons are accessible from the Buttons: Set pick list in the Market Depth Trader Buttons panel.
To create custom buttons, start in the Buttons section of Market Depth Trader Global Configuration. First create a new Button set, and then add one or multiple buttons to the set.
Create a Generic Button Set
To create a set that can be used across all instrument types, In Global Configuration select Market Depth Trader in the left pane, and then select Buttons. Click Create Custom and enter a name, for example Custom Buttons 1. The new set is displayed in the right pane and by default includes the Close Position, Reverse Position View account buttons. Click Add Button to create a button. Select the action, and in the Button Appearance section uncheck Generate label to customize the button label using the Button text field. Click OK to add the button to the set. Easily Duplicate, Edit, Delete and rearrange buttons by holding your mouse over a button and using the displayed menu. To reorder a button, click and hold the move icon and drag the button to its new location in the list. Back in Market Depth Trader use the Button Set drop down to select the set and display custom buttons for use.
Create an Asset-Type Specific "Auto" Button Set
To create a set that can be used for a specific asset type, for example stocks, from Global Configuration select Market Depth Trader in the left pane. Select Buttons. Click Create New Set for... and pick an asset type. The new set is displayed in the right pane and by default includes the Close Position, Reverse Position View account buttons. Click Add Button to create a button. Select the action, and in the Button Appearance section uncheck Generate label to customize the button label in the Button text field. Click OK to add the button to the set. Easily Duplicate, Edit, Delete and rearrange buttons by holding your mouse over a button and using the displayed menu. To reorder a button, click and hold the move icon and drag the button to its new location in the list. Back in Market Depth Trader use the Button Set drop down to select Auto. If you have selected a stock instrument, that set of buttons will be displayed.
Create an Instrument-Specific Button Set
To create a set that can be used for a specific instrument, for example AAPL stock, from Global Configuration select Market Depth Trader in the left pane. Select Buttons. Click Create New Set for... and select Stocks (or select the Stocks set if already created). Click Create Ticker-Specific and enter a symbol, for example AAPL. The new set is displayed in the right pane and by default includes the Close Position, Reverse Position View account buttons. Click Add Button to create a button. Select the action, and in the Button Appearance section uncheck Generate label to customize the button label in the Button text field. Click OK to add the button to the set. Easily Duplicate, Edit, Delete and rearrange buttons by holding your mouse over a button and using the displayed menu. To reorder a button, click and hold the move icon and drag the button to its new location in the list. Back in Market Depth Trader use the Button Set drop down to select Auto. If you have selected AAPL, that set of buttons will be displayed.
We've added five new Pivot Point studies to our interactive charts. Pivot points highlight prices considered to be a likely turning point when looking at values from a previous period, either daily, weekly, quarterly or annually. Each pivot point study has its own characteristics on how these points are calculated. Find calculations for each in the following users' guide topics:
- Camarilla Pivot Points
- DeMark Pivot Points
- Fibonacci Pivot Points
- Floor Pivot Points
- Woodie Pivot Points
In addition, we added a new "Period" selector with additional pivot point periods, including weekly, monthly, quarterly, yearly and auto period selections.
- Day - the previous trading day, starting with the first trade of the day and ending with the last trade of the day.
- Week - The previous trading week, starting with the first trade of that week (generally Monday) and ending with the last trade of that week (generally Friday).
- Month - The previous calendar month, starting with the first trade of that month and ending with the last trade of that month.
- Quarter - The previous calendar quarter, with quarters defined as: Jan 1 - March 31; April 1 - June 30; July 1 - September 30; October 1 - December 31.
- Year - The previous calendar year, from January 1 - December 31.
- Auto - Detects the time period of the chart (daily/weekly/monthly/quarterly) and selects a period based on the time period of the chart.
To add studies to your charts, from a chart's Edit menu select Studies.
We've added 24 new data points to TWS that you can display as columns in your Portfolio, Watchlists and Scanners. Implied Volatility (IV) data points for options include IV Percentile, IV Rank, IV High and IV Low, for 13, 26 and 52 week periods.
- The IV Percentile data points indicate the percentage of days with implied volatility closing below the current implied volatility over the selected period.
- The IV Rank data points indicate where the implied volatility ranks between the selected period's high and low. A low rank indicates that the current value is closer to its period low.
- The IV High and IV Low data points show the maximum and minimum closing value (respectively) of the implied volatility over the selected time period.
To add Implied Volatility data columns to a TWS window, hold your mouse over an existing column name until the Insert Column command appears. Click Insert Column and scroll to the Options column group. Hold your mouse over a title in the group to see the tooltip definition. Click a title to add the column to your window.
Historical Volatility (HV) data points include HV Percentile, HV Rank, HV High and HV Low, for 13, 26 and 52 week periods.
- The HV Percentile data points indicate the percentage of days with historical volatility closing below the current implied volatility over the selected period.
- The HV Rank data points indicate where the historical volatility ranks between the selected period's high and low. A low rank indicates that the current value is closer to its period low.
- The HV High and HV Low data points show the maximum and minimum closing value (respectively) of the 30-day historical volatility over the selected time period.
To add Historical Volatility data columns to a TWS window, hold your mouse over an existing column name until the Insert Column command appears. Click Insert Column and scroll to the Prices column group. Hold your mouse over a title in the group to see the tooltip definition. Click a title to add the column to your window.
Investors who are interested in considering more than just financial factors as they make their investment decisions now have a new tool in the form of Environmental, Social and Governance (ESG) scores from Thomson Reuters. These scores and data points can be displayed in TWS as market data columns, and viewed as a graphical indicator displaying an overall score between 0 - 100%, with a breakdown of category (pillar) scores available when you hover over the ESG Overall score.
Both combined and individual (pillar) scores are available.Available data columns for Combined Scores includes:
ESG Combined Score - Thomson Reuters ESG Combined Score is an overall company score based on the reported information in the environmental, social and corporate governance pillars (ESG Score) with an ESG Controversies overlay. (comprises ESG Controversies Score, Resource Use Score, Emissions Score, Environmental Innovation Score, Workforce Score, Human Rights Score, Community Score, Product Responsibility Score, Management Score, Shareholders Score and CSR Strategy Score).
ESG Score - Thomson Reuters ESG Score is an overall company score based on the self-reported information in the environmental, social and corporate governance pillars. (comprises Resource Use Score, Emissions Score Environmental Innovation Score, Workforce Score, Human Rights Score, Community Score, Product Responsibility Score, Management Score, Shareholders Score, and CSR Strategy Score).
Data columns for category (Pillar) Scores include:
CSR Strategy Score - CSR strategy category score reflects a company's practices to communicate that it integrates the economic (financial), social and environmental dimensions into its day-to-day decision-making processes.
Community Score - Community category score measures the company's commitment towards being a good citizen, protecting public health and respecting business ethics.
ESG Controversies Score - ESG controversies category score measures a company's exposure to environmental, social and governance controversies and negative events reflected in global media.
Emissions Score - Emission category score measures a company's commitment and effectiveness towards reducing environmental emission in the production and operational processes.
Environmental Innovation Score - Environmental innovation category score reflects a company's capacity to reduce the environmental costs and burdens for its customers, and thereby creating new market opportunities through new environmental technologies and processes or eco-designed products.
Human Rights Score - Human rights category score measures a company's effectiveness towards respecting the fundamental human rights conventions.
Management Score - Management category score measures a company's commitment and effectiveness towards following best practice corporate governance principles.
Product Responsibility Score - Product responsibility category score reflects a company's capacity to produce quality goods and services integrating the customer's health and safety, integrity and data privacy.
Resource Use Score - Resource use category score reflects a company's performance and capacity to reduce the use of materials, energy or water, and to find more eco-efficient solutions by improving supply chain management.
Shareholders Score - Shareholders category score measures a company's effectiveness towards equal treatment of shareholders and the use of anti-takeover devices.
Workforce Score - Workforce category score measures a company's effectiveness towards job satisfaction, healthy and safe workplace, maintaining diversity and equal opportunities, and development opportunities for its workforce.
To add ESG columns to a tool, hover over a current column until the Insert Column command appears. Click the column, then scroll down to ESG - Combined Scores or ESG - Pillar Scores and select a field to add.
To help improve TWS performance especially for Advisors that manage a large number of accounts, we have streamlined the process for handling allocation orders. This new process will result in changes in both TWS and the API (when used with TWS version 975 or greater).
In TWS:
- In the Trade Log, Advisors will (by default) see a summary of the allocated orders. They can expand the summary to see partial fills and allocations for that order.
- When exporting FA allocation orders, only trades for the master account will be exported. Allocation details can be exported by selecting the individual account in the Trade Log first.
- Note that commissions for allocation transfers can also be viewed when the individual account is selected in the Trade Log window.
- When the Advisor selects "All" in the Trades window, that selection will show "All allocation order trades."
- Note that models cannot be selected from this list. Selecting a group will show "Group-specific allocation order trades."
- Advisors who trading using investment Models, selecting a group in the Portfolio window will show totals across accounts in the group, or totals for the "Independent" portion of acounts in the group. The Model breakdown is hidden for simplification.
For Advisor changes to certain API calls when using TWS version 975 or greater (reqPositions, reqPnl, reqPnLSingle, placeOrder, accountSummary, and accountUpdatesMulti), see the API guide.
2018
Build 974 - November 2018
We have improved the IV calibration method to provide a more comprehensive volatility surface. This results in improved model price and Greeks in TWS especially for deep in-the-money or far out-of-the-money options. To see the IV skew curve in the Implied Volatility Viewer, use the Search field in the Mosaic New Window drop-down to find the tool.
With the new auto-complete "Search" fields included on menus, in the New Window drop-down, and in the right-click menu from any symbol in your Watchlist, Portfolio or trading page, now it’s easier than ever to access the tools and information you need within TWS. Avoid navigating through multiple layers of menus by simply typing what you need in the relevant search field and clicking the desired result to load the tool or window you need.
Click the Mosaic Account menu, and instead of navigating down to Activity and then to Activity Statements, simply start typing "Activity" in the Search box.
Now go to your Watchlist or Portfolio and right-click an instrument. Instead of navigating down to Charts and then New Chart, just start typing "chart" in the Search box.
When you click the New Window icon in Mosaic, your cursor opens in the new Search field. Simply enter a tool or feature name, like "options" or "Advanced Market Scanner". As you start to type, the list of tools updates to fit your search, based on both the title and the feature itself. For example, typing "options" will not only return "Option Chains" and "OptionTrader," but also "Implied Volatility Viewer" and more, all of which are option-centric tools. When you see the tool you want, simply click to open.
For convenience, tools that you have recently opened appear at the top of the list in the “For You” section.
When BookTrader is in "armed" mode, clients can bypass order confirmation screens and quickly submit orders to the market with a single click. We have detected instances where, due to various hardware issues, clicks occur in rapid succession. We have added a safeguard that combines these actions that are within 1/2 second of each other into a single action. If this action suppression does occur, you will receive a message that TWS has suppressed suspected erroneous duplicate action.
If desired, you can disable this feature in Global Configuration>Trading Tools>BookTrader>Settings by unchecking the box.
Both TWS and the IB Gateway require daily restarts to refresh data. As a convenience, we now offer an auto-restart feature that will restart your application throughout the week and only require a manual restart and authentication once/week, each Sunday. TWS users will find this feature works most effectively with the TWS Offline version.
Please review these considerations before you enable the auto restart feature.
An issue that resulted in OptionTrader being unable to find CNH options on HKFE has been fixed.
This latest release also includes under-the-hood fixes to improve performance.
Build 973 - July 2018
You can close multiple, independent options positions (on the same underlying) as a single, complex, multi-leg order. Use the Mosaic or Classic portfolio to select up to six independent options positions to use as legs of a new, complex, multi-leg order. Once legs are selected, use the right-click menu and choose the “CLOSE AS STRATEGY” trading button. The Strategy Builder opens with the option’s underlying loaded in the Option Chain and the selected position “legs” highlighted. The complex position opens in the Strategy Builder Order Entry, where you can modify as needed.
Note that you will only see the CLOSE AS STRATEGY button if:
- Option legs are on the same underlying and use the same primary exchange or multiplier.
- Futures options legs are on the same underlying contract and use the same primary exchange or multiplier.
- You select independent positions as legs. If you want to include all or part of an existing complex position in your selection, expand the position and select each leg one by one.
This feature is designed to create an order that will completely close the selected positions, and calculates the order quantity accordingly, based on the leg ratio. For example, if you elect to close two positions where position A has a quantity of 3 and position B of 6, the ratio is simplified to 1:2 and the position quantity is set to 3. You can modify the quantity if you prefer to close only a portion of the selected positions.
Currently this feature is only offered for individual accounts. For multiple account structures, this feature can be used if a single account is selected.
Client who have managed partitions in their account that they cannot trade or sub-accounts managed by an advisor will now see only the mark price for positions instead of real-time data so that their account's market data allotment is not used up on assets that they can't trade. You can turn this feature off and show real-time data for these non-tradeable accounts by going into Global Configuration > Display > Ticker Row and checking "Always show market data for accounts and account partitions traded by your advisor." Note that this message will not display if your account does not have any advisor-managed partitions or sub-accounts.
Build 972 - May 2018
The pre-defined strategies list in the Strategy Builder now includes the Unbalanced Butterfly spread. In contrast to a Butterfly spread where the strikes for the two "wings" are equidistant from the middle strike, the Unbalanced Butterfly has one "wing" farther out from the middle strike. For example, where a Butterfly might have strikes of $72.00/$74.00/$76.00, the unbalanced version might have strikes of $72.00/$74.00/$79.00.
To create an Unbalanced Butterfly spread in Mosaic, select an asset in a Watchlist or Portfolio and use the right-click menu to choose Trading Tools and then Option Chains. Toggle the Strategy Builder "on" in the bottom panel and click the pick list of strategies on the right side. From the displayed list select Unbalanced Butterfly. Within the Option Chain, mouse over any strike price to see the potential spread highlighted. To modify the spread width, use the mouse scroll key, roll up to widen the spread and roll back to compress it. When you're ready to load the spread into Strategy Builder, click a bid or ask price in the Call or Put section. This becomes the middle leg of the spread.
You can easily modify a loaded strategy or a leg of the strategy. Within the chains, mouse over one of the legs to see the cursor change to a grabbing hand. To change one leg, click, drag and release on the new strike. To change the entire strategy, depress the Shift key while you click and drag the whole strategy to a new set of strikes.
When entering options, futures options and multi-leg strategies via the API, the strike price for contracts whose underlying price is expressed in pennies (for example certain futures contracts on ECBOT or stocks on the LSE) must be entered using the “display” format (e.g. 490) instead of the dollar format (e.g. 4.90). Please check the contract details for specific products when submitting orders through the API.
Previously the account “rounding” feature was only configurable when using TWS, and so could not be de-selected when using the API with IB Gateway1. A new API-specific rounding setting has been added just to round account values returned to the API. When this setting - "Round account values to nearest whole number" - is checked in the associated session of TWS or the IB Gateway, it will round values sent to the API. Note that by default this feature is unchecked (values sent to the API are not rounded by default).
To access TWS Global Configuration, use the File menu (from Mosaic) or the Edit menu (from Classic). Select Global Configuration and then select API > Settings.
To access the settings in IB Gateway Configuration, from the Configure menu select Settings > API > Settings.
Build 971 - May 2018
Understand at a glance the impact that trading a complex strategy will have on your account with the new "Debit" and "Credit" designations included in the Limit Price field of the Order Entry panel. See this change in Mosaic, in the Strategy Builder, and anywhere the Order Entry panel is used to submit complex multi-leg orders.
We now offer a simple-to-use grid interface with spread templates for comparing and creating option spreads, accessible from the Option Chain page. This grid interface allows you to easily compare prices, spread tightness, Delta, and Gamma across a range of similar strategies and quickly populate the Strategy Builder with the one you want.
To use the Spread Templates, from the Option Chain page use the drop-down in the blade (to the right of the symbol) to choose a strategy (Horizontal, Vertical or Diagonal spread). The grid layout appears with the view centered near the current strike price. You can toggle the first leg between calls and puts using the Calls | Puts selector in the upper right corner. Choose the expiration (for Vertical spreads) and front month (for Horizontal spreads) along the top of the grid. For Diagonal spreads, use the Front/Back drop-down arrow to select a front and back month.
Once the spread parameters are defined, use the bottom and side scroll bars to scan and compare. Click a box within the grid to populate the Strategy Builder. As you create the multi-leg complex strategy, the Order Entry panel below the Strategy Builder populates with the strategy's bid and ask prices. Additionally, it now also identifies the limit price as "Debit" or "Credit" in the Limit Price field.
A new selector in the Scenarios blade of the Performance Profile window lets you choose between displaying the "Instrument Greeks" that show the traditional contract Greeks, and the "Position Greeks" calculated using ( Greek value x position). "Position Greeks" are identified in the Scenarios panel with a "P" prefix, for example P.Delta etc. For strategies that use different underlyings, "Instrument Greeks" are not available and the selector is disabled.
To use the Performance Portfolio analysis tool, click the "Profile" button below a strategy in the Strategy Builder. From your Watchlist or Portfolio, right-click a strategy and from the menu select Analytical Tools and then Performance Profile.
You can now view a report for Exposure Fee on demand from within the Risk Navigator. Add the "Exposure Fee" tab by selecting "Exposure Fee" from the Risk Navigator Report menu. This tab shows a projection/estimation of any exposure fees, based on the current positions in the portfolio (both actual and what-if).
To find out more about Exposure Fees, see the Exposure Fee for High Risk Margin Accounts section of the Margin Trading page.
We have added new standalone windows to view the Dividend Schedule and Interest Rate Term Structure. Previously these tools were only available via the Model Navigator, where they are still available, and are also editable, allowing you to enter your own values. To view the Dividend Schedule for a selected asset, use the New Window drop-down and select Option Analysis, then Interactive Analytics then Dividend Schedule. To view the Interest Rate structure, use the New Window drop-down and select Option Analysis, then Interactive Analytics then Interest Rate. Alternatively, you can select both tools from the right-click menu within the Implied Volatility Viewer.
The 3D Volatility Surface webtool now allows you to specify the volatility unit. By default the unit is set to daily, but you can change it to "annual" using the Volatility Unit radio buttons under the "Displayed Last Trading Dates." To open the 3D Volatility Surface webtool, click the "3D" button in the Implied Volatility Viewer. Alternatively, use the New Window drop-down and select Option Analysis, then Interactive Analytics, then 3D Volatility Surface. Then, select the symbol for which you want to view the 3D vol surface.
We now calculate the SPX Greeks for live options trading outside regular trading hours, when the option's underlying is closed. Values are based on the theoretical underlying price that is implied based on the lead futures. This is reflected throughout TWS and in the IB Risk Navigator.
The Accumulate/Distribute Algo window has been modified to require a user to specify the order side (BUY or SELL) instead of offering a default order side.
To find out more about the Accumulate/Distribute algo, see the TWS Users' Guide
- When changing a hedging contract for an Attached Delta Hedge order, the order side would flip and make the order invalid. This has been fixed.
- We have made the Performance Portfolio sidecar attached to the Strategy Builder more useful by enlarging the Quote Details tile to display all data without needing to scroll, and by defaulting to today's data so that important data, specifically today's total delta and theta, are visible when the sidecar opens.
- The "Average Price" calculation in partitioned portfolios was incorrect. This has been fixed.
Build 970 - March 2018
The Strategy Builder tool included allows you to easily build complex, multi-leg strategies from an option chain by simply clicking the Bid or Ask price of a call or put to add the leg to your strategy. We’ve made this process even easier with new Predefined Strategies pick list in the Strategy Builder. When you select a strategy and hover over the price for the initial leg, TWS highlights the other legs that will be included in the strategy. Simply click the first leg and see the fully-editable strategy come together in the Strategy Builder.
The animation below shows the user creating a Butterfly call, using the mouse scroll button to move the point spread, and then using the Shift + drag feature to move the starting leg from the bid to the ask price to change the strategy from a long to a short butterfly call.
To create a predefined strategy, open an option chain (select a symbol and use the right-click menu to choose Trading Tools and then Option Chain). Turn on the Strategy Builder tool using the toggle at the bottom of the chain. The list of predefined strategies is displayed on the far right side of the window. Select a strategy, and in the option chain hold your cursor over the Bid or Ask price of the put or call for the first leg. The other leg(s) that will be included are highlighted. Click the price to add the highlighted legs to the Strategy Builder. Alternatively, keep your cursor over the price for leg 1, and use the mouse scroll button to widen or narrow the spread between the other legs. When satisfied, click the price to add the highlighted legs to the Strategy Builder.
Use the buttons along the bottom of the Strategy Builder:
- Click "Clear All Legs" to start fresh and remove all legs from the current strategy.
- Click “Profile” to see the Performance Profile sidecar for the strategy.
- Click "Add to Watchlist" to include the strategy in the currently selected Watchlist.
Use the Order Entry panel below the Strategy Builder to trade the strategy.
Tips:
- To modify a strategy or legs within a strategy:
- Within the chain, use shift + mouse key to grab, drag and drop to move the entire strategy.
- Within the chain, click and drag any leg to a new strike.
- In the Strategy Builder (below the chains) delete a leg, or use the pick lists to change the parameter within a leg.
- In the Strategy Builder (below the chains) click “Clear All Legs” to start fresh and remove all legs from a strategy.
- Easily change the strategy from long to short or short to long by dragging a leg from the ask to the bid price (or vice versa). To drag, click and hold the shift key.
- When needed, the Option Chain view will change to List View (for strategies that use different expirations).
- While holding your cursor over the bid or ask for a leg (without clicking), use the mouse scroll key to widen or narrow the spread between legs.
- To use a different strategy, simply choose a new strategy and click the bid or ask for a put or call. The old strategy is cleared and the new one takes its place.
Use the Mosaic Roll Builder tool to roll a multi-leg option or stock/option combination position to a new expiry. If all or part of your existing multi-leg combination position is about to expire, or if you just prefer to open the position in another expiry, you can easily roll the entire, intact strategy using the Roll Builder tool. The full combination is routed to reduce execution leg risk, and may receive price improvement versus submitting the order using individual legs. And if a leg has become worthless and you prefer to let it expire, simply leave it out of the “roll into” construction.
To roll a multi-leg combo, select the combination position from your Portfolio, or from any Watchlist to which it was added, and from the right-click menu click the “Roll” button.
In the Roll Builder tool, the current multi-leg position appears at the top and shows each individual leg. For each highlighted leg of the combination, select the contract you want to roll into from the option chains displayed above the Roll Builder. For convenience, current legs are also highlighted in the Option Chains, in red for sells and blue for buys, and are marked with a filled-in circle. The new legs are identified by an empty circle.
As you build the new combination, it is shown below the current combo position in the “Open” section of the Roll Builder. As you add new legs to roll into, you can modify any element (action, ratio, last trade day, strike or type) by clicking in the desired field and selecting or entering a new value. When adding new legs, we pre-select the buy/sell action to logically match your original combination. Note that the ratio is always set to 1. Additionally, the order price is updated and the Margin Impact is shown in the Order Entry line. Click Margin Impact to also view the “Estimated Combo Premium,” “Estimated Existing Combo Premium,” and “Roll to Estimated Combo Premium.”
This tool is available for futures options, options and covered stock strategies that include up to four legs. Note that the maximum number of legs might be lower depending on the destination.
You can now view Traders' Insight videos and IBKR Quant articles directly in TWS from News panel. IBKR Traders' Insight is designed to give traders an edge by providing daily global commentary and market color from IB analysts and market participants.
To view videos, click the "add tab" icon in the News panel and select Traders' Insight Videos. It's that simple! To move through the videos, hold your mouse over the video display to bring up the "forward" and "back" controls, and use these to move through available offerings. To watch on a larger display, use the right-click menu when you're on the tab to detach it from Mosaic. In addition to viewing videos, you can also add a tab to stream IBKR Traders' Insight articles and the IBKR Quant blog via the news feed.
IBot, our natural text interface to trading, can now guide you through creating a powerful, custom Accumulate/Distribute algo through a series of simple questions. Accumulate/Distribute was designed to help traders buy or sell large quantities over time, minimizing market impact by submitting orders in smaller components, randomizing size and time.
To create an Accumulate/Distribute algo using IBot, simply enter an Accumulate/Distribute-relevant command, such as accumulate 2300 shares of IBKR" or "distribute 2300 shares of IBKR" or "buy 3000 shares of IBKR using accu/dist algo" etc. IBot will present a series of simple parameters for you to complete. You have multiple ways to provide order details to IBot when creating your algo:
- Click a "Next Step" entry (or use the associated keyboard shortcut) for a value.
- Enter or change a value in the text entry box.
At any time in the process, use the Preview Order list item to see the progress of your algo. When the algo order is complete, IBot presents a full summary of the order as you defined it. You can elect to Submit the order, Edit the order using the full Accumulate/Distribute interface, or Cancel the order. This feature is available in TWS for Mobile and through IBot on the Client Portal.
Please note that this feature is being rolled out to clients gradually. To find out more about IBot, visit the IBot feature page.
The Performance Profile sidecar can now be launched from within the Strategy Builder, and will reload as legs are added/removed from the strategy or ratios are changed. The Strategy Builder can be enabled at the bottom of the Option Chain tool by toggling it to On. Strategy Builder makes it easy to create multi-leg complex strategies that you can then add to a Watchlist and/or trade.
From within the Strategy Builder, open Performance Profile by clicking the "PROFILE" button at the bottom of the Strategy Builder, to the left of the "Add to Watchlist" button. Click the "Add to Watchlist" button to add the strategy to the bottom of the "Favorites" Watchlist.
We have also added additional data points to the Performance Profile, including:
- Min Invest: The minimum amount required to invest in the strategy. Debits show as positive value; credits show as negative values.
- Break Even: This is the price/value of the underlying required for the strategy (or leg) to break even at expiration. Strategies with more than two legs may have multiple "break even" points.
- Margin Impact: Shows the potential impact on your maintenance margin of buying 1 contract.
- Commission (and Commission%): The potential commission based on the Minimum Investment amount.
See these and other data points in the Quote Details section of the profile.
Note that you can also access Strategy Builder from within the OptionTrader tool using the Strategy Builder tab.
You can now trade CME-directed delta-neutral FOP/FUT combinations on the CME. Use the ComboTrader to create these spreads directed to GLOBEX, ECBOT, or NYMEX.
To create this spread, use the Classic TWS interface, enter the contract symbol and from the instrument selection list choose Combinations > Future Option Combos (Directed) > NYMEX (USD) (or GLOBEX or ECBOT based on contract). When ComboTrader opens, use the Strategy tab to select the Delta Neutral (N) strategy, and then choose a trading class. The section to enter the FOP contract appears. Select the FOP contract using the selector boxes. In the “Underlying” section, specify the futures contract month, delta, and underlying price. Tab again to enable the action buttons, and select OK to add the combination to your Quote Details page.
To trade the spread, select it in the Quote Details page and use the Order Ticket to submit the order. To open the Order Ticket:
- Right-click the spread and select Trade > Order Ticket, or
- Select the spread and click the “Order” icon in the toolbar.
In TWS release 969 we added support for real-time last tick data to the Time & Sales window for all products that support it, including stocks and futures worldwide. Now, the Multi-Contract mode in Time & Sales also supports real-time last tick data for those products that support it. All other products will continue to show real-time Time & Sales derived from the aggregated real-time volume.
If you prefer to use real-time aggregated/averaging of trades (approximately every 3-4 seconds) instead of tick-by-tick data for all products, go to Global Configuration > Information Tools > Time & Sales > Settings, and check "Always use real-time volume to approximate Time and Sales data."
You can now view the Mark Price IV for a contract in the Implied Volatility Viewer by selecting "Mark Price" from the Display section of the right-click context menu in the viewer.
To open the Implied Volatility Viewer, from the New Window drop down select Option Analysis > Interactive Analytics > Implied Volatility Viewer.
To find out more about the Implied Volatility Viewer, see the TWS Users' Guide
In Risk Navigator, you can now select multiple options or futures contracts when adding them to a "What-If" portfolio.
The Futures Term Structure now lets you display past-date futures in historical term-structure curves.
For more information on the IB Risk Navigator and Futures Term Structure tool, see the TWS Users' Guide.
To remove any potential ambiguity, the tradingHours and liquidHours fields of the ContractDetails class now have the date included with both the start time and end time of each session.
Example: tradingHours = 20180316:0400 - 20190316:2000;
- The Unified Events Calendar now provides a "Time" column in the Economic Events section. To view the Unified Events Calendar, from the Mosaic Anchor Window click Event Calendar. Find out more in the TWS Users' Guide.
- Several IBot fixes to support Accumulate/Distribute algo orders including removing the Display Size attribute from A/D market orders and ensuring the negative values are not accepted in certain fields, e.g. the Increment and Display Size fields.
2017
Build 969 - December 2017
TWS and the API now support MiFIR reporting. In TWS:
- Define a default decision-maker and execution trader for both TWS and the API in Global Configuration;
- Specify decision-maker on a per-order basis in Mosaic Order Entry, and Classic order line and order ticket.
Set Defaults in Global Configuration
You can define default TWS and API decision-maker and execution trader values in Global Configuration for MiFIR reporting. To access these settings, in TWS Global Configuration go to Orders and then select MiFIR. Define the following default values:
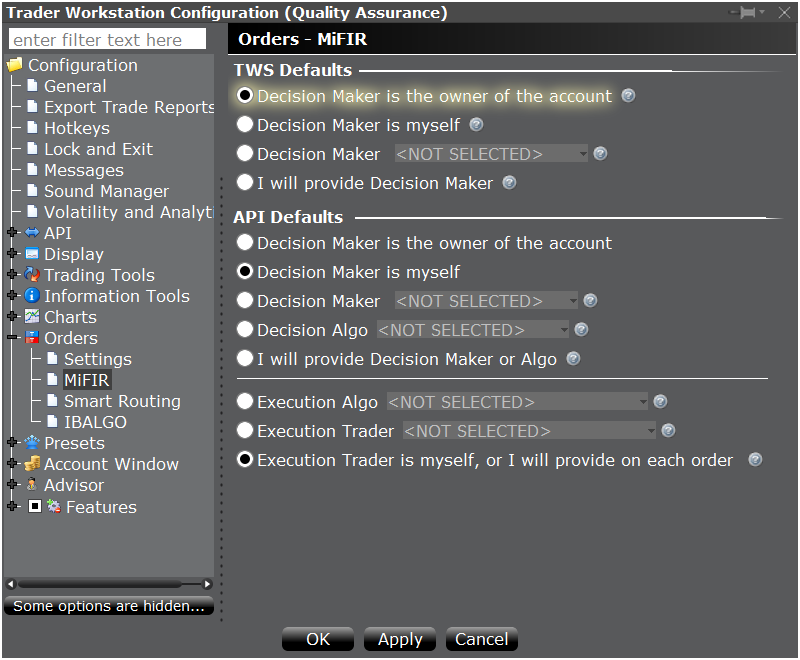
TWS Defaults
- Decision Maker is the owner of the account - The account owner will be named as the default decision-maker for all orders submitted via TWS.
- Decision Maker is myself - You, the trader, will be named as the default decision-maker for all orders submitted via TWS.
- Decision Maker: - Select a decision maker to use as the default. Choices are those that were defined in Account Management.
- I will provide Decision Maker - No default decision-maker will be named; you must define a decision maker on a per-order basis.
API Defaults
- Decision Maker is the owner of the account - The account owner will be named as the default decision-maker for all orders submitted via the API.
- Decision Maker is myself - You, the trader, will be named as the default decision-maker for all orders submitted via the API.
- Decision Maker: - Select a default decision maker to use as the default. Choices are those that were defined in Account Management.
- Decision Algo: - Select a default decision algo to use as the default. Choices are those that were defined in Account Management.
- I will provide Decision Maker or Algo - No default decision-maker or decision-algo will be used by default; you must define one on a per-order basis.
Execution Defaults
- Execution Algo - Select a default executing algo to use as the default. Choices are those that were defined in Account Management.
- Execution Trader: Select a default executing trader to use as the default. Choices are those that were defined in Account Management.
- Execution Trader is myself, or I will provide on each order - No execution trader or algo will be used by default; you must define one on a per-order basis.
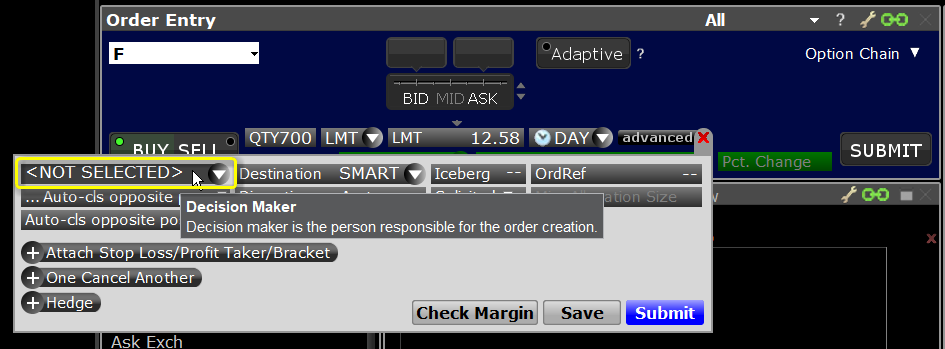
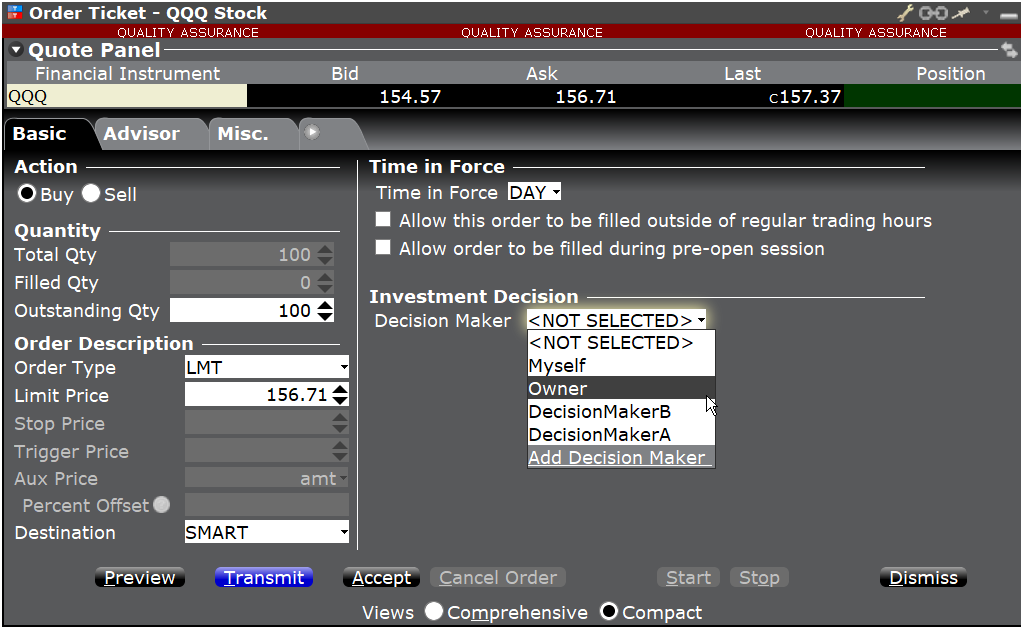
TWS Per-Order Decision-Maker Selection
You can specify a decision-maker or change the default on a per-order basis from the Mosaic Order Entry panel, the Classic order line, or the Order Ticket.
From Mosaic Order Entry, use the advanced panel to display the decision-maker drop-down. If you defined a default selection in Global Configuration, that value is displayed; if you did not set a default, the field displays "NOT SELECTED" and you must define a decision-maker for the order to be accepted.
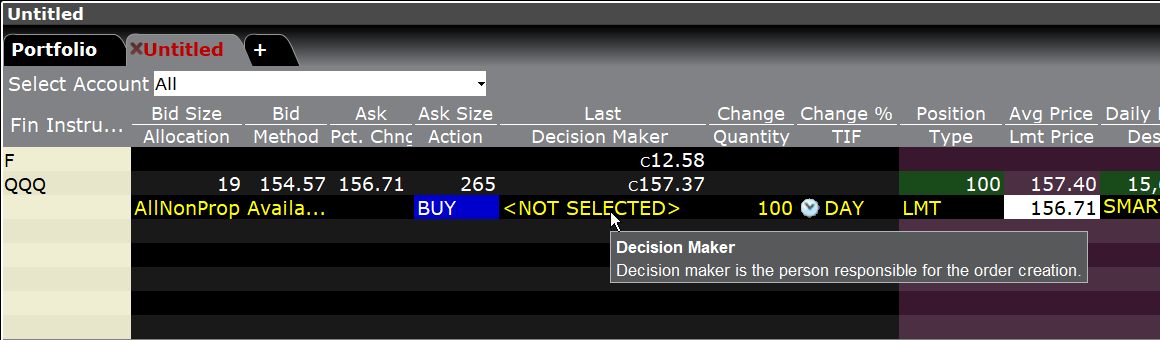
From the Classic TWS order line, use the Decision-Maker field drop-down to make a selection. If you defined a default decision-maker in Global Configuration, that value is displayed; if you did not set a default, the field displays "NOT SELECTED" and you must define a decision-maker for the order to be accepted.
From the TWS Order Ticket, select or change the decision-maker from the Investment Decision section of the window. If you defined a default decision-maker in Global Configuration, that value is displayed; if you did not set a default, the field displays "NOT SELECTED" and you must define a decision-maker for the order to be accepted.
For more information about MiFID, see the Overview of MiFIR Transaction Reporting page.
We have added a new Intraday Volume-Weighted Average Price (Intraday VWAP) study to our charts. This study tracks VWAP throughout the day, and displays as a colored line linking VWAP values at varying times throughout the one-day period. By default, the line that tracks Intraday VWAP is bracketed within a high/low standard deviation range. The standard deviation is calculated for the same period as the VWAP, and the range can be adjusted by modifying the number of Standard Deviations within the settings of the Intraday VWAP.
Intraday VWAP is calculated as: VWAP=[sum (Volume_bar_i * Typical_price_i)]/sum(volume_bar_i) where i is the intraday bar number. If we use a 1 min daily bar chart, the calculation is made from the first minute with i=[1;N] where N is the last bar number of the chart, Typical_price_i = VWAP_on_bar_price_i => This is the VWAP we currently store and volume_bar_i is the volume for the bar i. If no volume is available for the product (i.e. for IND, CASH and CMDY), use 1 as volume for each bar.
Add this study from the Volume Studies section of Chart Studies. Additionally, display the bar VWAP by checking VWAP of the bar found in the Additional Parameters and Features section of the Chart Parameters page.
Note that the Intraday VWAP study is only valid on charts with access to the data points needed to calculate it, specifically high, low, close and volume. Choosing "Trades" as the What to Show parameter always provides these data points.
IBot can now understand and process most common government and municipal bond queries. Ask IBot to buy, chart, view and quote bond contracts, by ISIN, CUSIP for all bonds (US government, foreign government, municipal and corporate) or by contract name for all US government bonds. Enter requests in normal language, such as “buy 3-month t-bill,” “chart US-T Bill Jan25'18 for 1 week with hourly bars", “show ten year treasury bond”, “buy 043771ES9 bond” and “show 30y treasury bond.”
To use IBot, from the New Window drop down in Mosaic select “IBot – type to trade.” Enter commands in the text entry field and hit Enter to submit.
To find out more about IBot, see the IBot feature page.
IBot can now help you complete tasks that require log-in access to Account Management (AM). When you ask IBot about funding, reports, market data and other AM-related tasks, IBot recognizes these requests and opens the relevant AM page for you in your web browser. For example, to fund your account you could enter: “Fund my account” and IBot will open Account Management in your browser window to the correct page. IBot can put you where you need to be for many AM tasks, like depositing and withdrawing funds, viewing PortfolioAnalyst reports, accessing Activity Statements, and making changes to your market data subscriptions.
Some of the Account-Management related commands IBot can help with include:
Funding
- withdraw funds from my account
- Deposit funds
- Deposit money
- Deposit $1000
- Transfer cash
- wire
Trading Permissions
- Update my trading permissions
Trade History
Depending on how far back you want to go with your trade history, IBot will determine whether to show you a list of your recent trades, bring you to the TWS Trades Activity window, or open the Trade Confirmations section of Account Management.
- Recent trades
- Trade confirmations
- trade log
- See my trade history
- trade history
- Previous trades
- Show me this week's trades
PortfolioAnalyst
- Portfolio Analyst
- Custom benchmarks
Activity Statements
- Show my P&L history
- account summary
- MTM summary
- Realized summary
Market Data
- change market data subscriptions
- subscribe to...name of provider
- Subscribe to live data for ...name of symbol
- Do I subscribe to live data for ...name of symbol
To find out more about IBot, see the IBot feature page.
As we continue to enhance IBot's power for your benefit, you will start to notice that the "Next Step" actions you are offered after a command become more and more useful to you. IBot is keeping track of the most popular "next step" actions, and as it learns it will offer these to you at the top of the list to make your trading experience even more efficient.
For example, if you ask to see the price of AAPL, the current next steps might be Show Chart, Buy, Sell, Tell me more. After collecting data of most popular next steps following a price inquiry, the next steps might change to be Buy, Show Chart, Show Analyst Rating, Tell me more.
A new Short Selling column for stocks and ETFs, Utilization, is now available in TWS. This value, displayed as a percentage, is the ratio of “shares lent” to “shares available,” and illustrates the general level of demand for an asset. The Utilization percentage is calculated as:
Number of shares loaned (across all outstanding loans) ÷ number of shares available to loan (from lending agents)
The utilization ratio provides insight into the potential value of shares you own, and may be especially useful to IB clients who participate in the Stock Yield Enhancement Program, or are considering doing so. Theoretically, the larger the Utilization percentage, the greater the demand for the asset.
To add the Utilization column, hold your mouse over an existing market data column and click the Insert Column pop up. Scroll down to the Short Selling category and select Utilization.
Visit the Securities Financing page to find out about the benefits of lending shares you currently own via IB’s Stock Yield Enhancement Program.
We now offer Tip Ranks fundamental analysis for U.S. stocks, available through new tabs in the Analyst Ratings (Summary) and Analyst Ratings (Details) windows. To access these features, right-click a U.S. stock and select Analytical Tools and then Company Fundamentals. In the Fundamentals blade next to the stock symbol, use the drop down list to select the Analyst Ratings (Summary) or Analyst Ratings (Details) window.
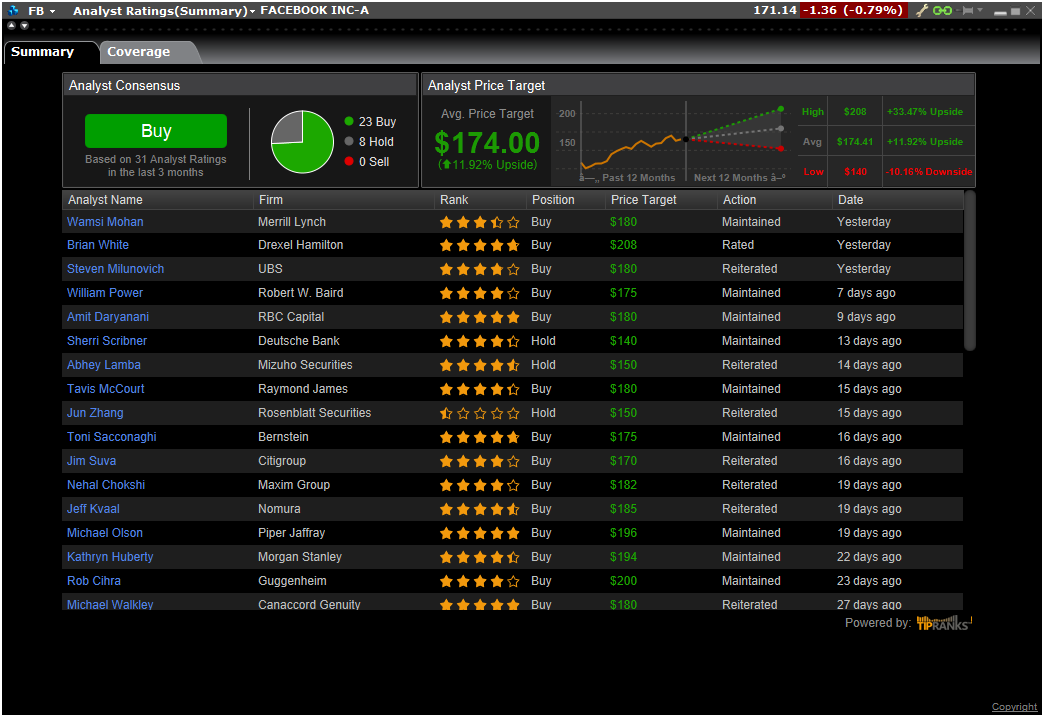
The Summary page now shows two tabs: Summary is the original view, and Coverage is the new Tip Ranks view. See the Analyst Consensus and its breakdown, the Analyst Price Target, and a list of analysts.
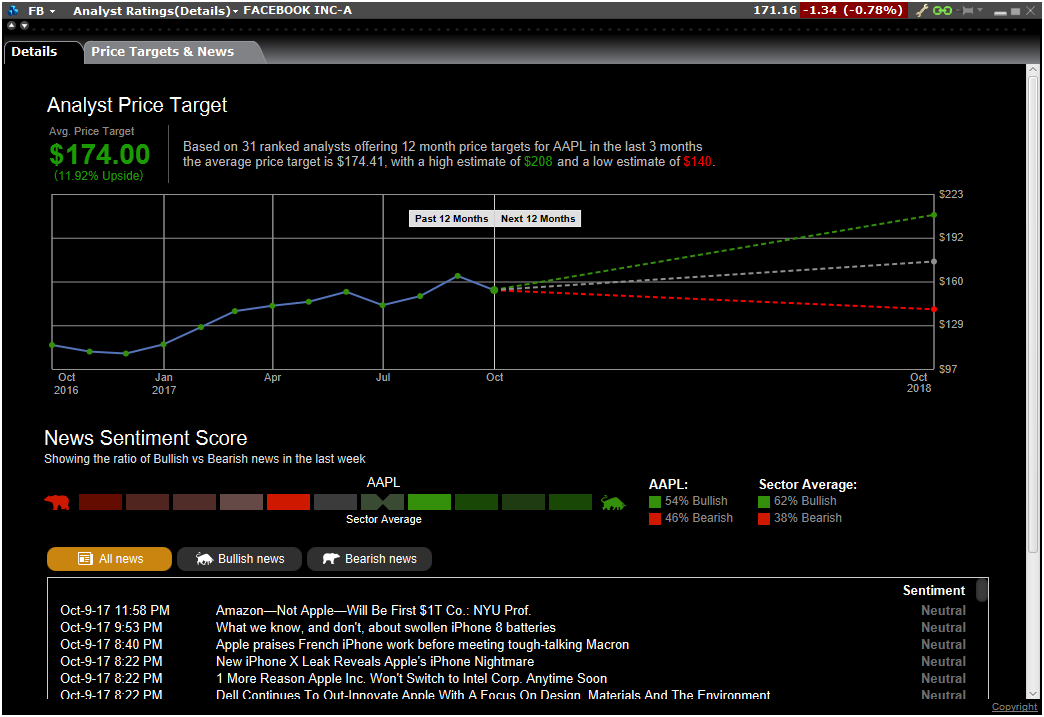
The Details page also shows two tabs: the original view in the Details tab, and Tip Ranks data in the Price Targets & News tab. See the Analyst Price Target along with New Sentiment Score, which shows the ratio of Bullish to Bearish news in the past week. Select a new headline to view the full article.
The Time & Sales windows will now use real-time last tick data for all products that support this feature, which includes stocks and futures worldwide. All other products will continue to show real-time Time & Sales derived from the aggregated real-time volume. If you prefer to use real-time aggregated/averaging of trades (approximately every 3-4 seconds) instead of tick-by-tick data for all products, go to Global Configuration > Information Tools > Time & Sales > Settings, and check "Always use real-time volume to approximate Time and Sales data."
The IB API beta in conjunction with TWS version 969+ also supports this feature through the new reqTickbyTickData function which provides real-time data for up to five (5) US securities.
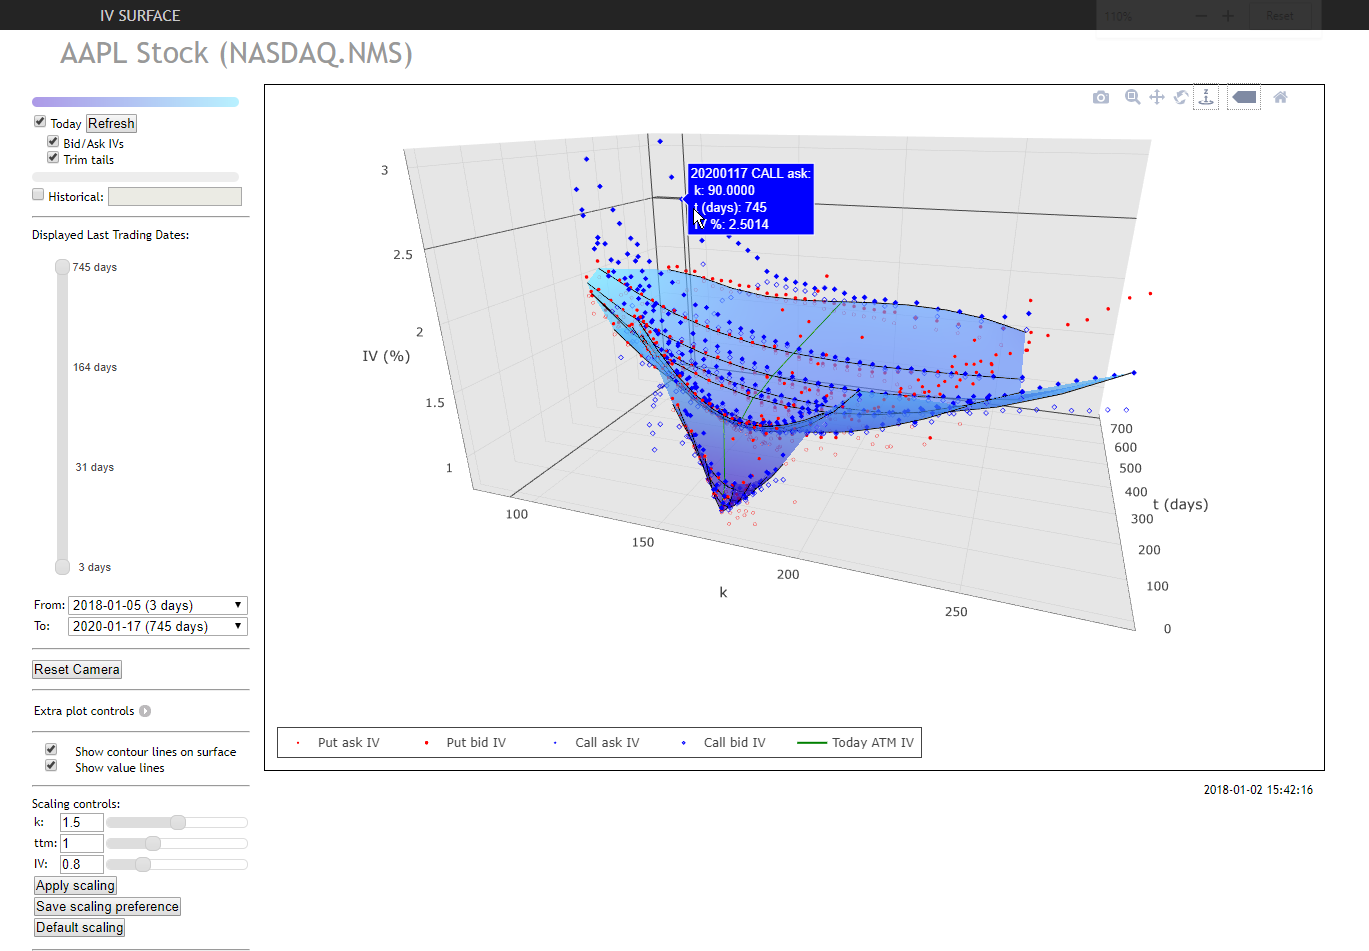
You can now view Implied Volatility in 3D using the 3D Volatility Surface webtool accessible from within the Implied Volatility Viewer. Simply click the "3D" button to study the model volatility surface of contracts in 3D! Display the model surface together with individual option IV points, or compare the current surface with any historical value by plotting them together. Click and drag the plot to rotate the view, and scroll within the plot to zoom. Expand the "Extra plot controls" to show contour and value lines and manipulate scaling using sliders.
More enhancements to the IB Risk Navigator include:
- The ability to open the Implied Volatility Viewer using the right-click "Charts" menu from any instrument line, and from with Risk Navigator using the right-click menu from any instrument.
- Two new columns, "Adjusted Vega" and "Custom Adjusted Vega" which can be added from the Metrics > Position Risk menu. The Adjusted Vega multiplies the Vega by an in-house term structure function. The custom adjusted vega (Vega x T-1/2) multiplies the Vega by the inverse square root of the number of calendar days to expiry.
- For single account users, you can now enable "Group legs into complex positions" from the Settings menu to view named strategies in reports.
- What-ifs: You can now add borrowing power and Debit card spending limit estimations to the dashboard view from the View menu, and you can remove unresolved positions from the right-click context menu of the Not Included list.
US client accounts that have US Futures trading permissions can now trade swap futures on the Eris Exchange in TWS. In addition to having US Futures trading permissions, you must also subscribe to "ERIS Market By Order" market data in Account Management. We currently offer four Eris swap futures for trading: ZA9102 with maturities of 2019 DEC and 2020 MAR, and ZB9105 with maturities of 2022 DEC and 2023 MAR. When you add Eris futures contracts to your watchlist they are displayed using the maturity date.
Build 968 - October 2017
A new tab, Volatility Products, has been added to the IB Risk Navigator. This tab only displays Volatility-based products, including:
- Derivatives based on the widely recognized volatility indexes that are based on an underlying equity or index. These products will also be reflected on the Equity tab, but only the equity Vega contribution, translated from the Delta of the volatility product, will be displayed. (Delta exposure to the volatility index is equivalent to Vega exposure to the underlying, in the proportion: Vega (underlying) = Delta (derivative of Volatility Index) x (Volatility Index-specific scaling factor).
- Funds including ETFs/ETNs composed of portfolios of instruments providing exposure to some volatility indexes. Again, the Delta of the volatility product will be transformed to Vega for display on the Equity tab. Assuming the fund has constant sensitivity to some volatility index, its Delta can be translated to the Vega of the underlying as follows: Vega (underlying) = Delta (to fund price) x (Sensitivity of fund price to Volatility Index) x (Volatility Index-specific scaling factor).
The price sensitivity of ETF/ETN funds to volatility indexes has been shown to be approximately stable using our default beta calculation methods, but some users may want to express a view that is different from what the historical data would suggest. To do this, right-click the contract in the report and select Tracker/Measure Beta..., then enter the user defined value that you want to override the historical estimate.
To display this tab, open Risk Navigator from the New Window drop down list, and from the View menu select Volatility Products tab. You will be asked to close and re-open Risk Navigator for this change to take effect.
To find out more about the Volatility Products tab and its data, see the TWS Users' Guide.
In addition to the new Volatility Product tabs, Risk Navigator has several other enhancements:
- We have added the column "Time to Maturity (in cal days)" for reports. To add this column to a report, from the Metrics menu select Contract Risk and then select "Time to Maturity (in cal days)".
- We now show you the number of open (category-related) positions in the product tab next to the title.
We continue to make IBot smarter. In cases where there is more than one interpretation of your inquiry, IBot will ask you to pick among several options. Your selection will be remembered, and will be used to improve IBot's comprehension.
You can view and edit order quantity in two fields. The "Total Quantity" field which always displays the orders's original size, and the "Quantity" field, which updates as the order fills to reflect the shares remaining to fill. The Quantity field is also labeled "Outstanding Quantity." In addition to these editable fields, the read-only "Filled Quantity" field reflects the number of shares that have filled (Quantity + Filled Quantity = Total Quantity).
By default, you are able to edit the"(Outstanding) Quantity" field. To also enable editing of values in the "Total Quantity" field, in Global Configuration go to Orders and then Settings. and check "Allow editing Total Quantity." You may deselect "Allow editing Outstanding Quantity" if desired, but you cannot disable both quantity editing fields.
Build 967 - August 2017
The redesigned Mosaic Order Entry panel with the Adaptive algo button, Relative Price buttons, and Relative Price Wand supports faster and more efficient order entry, and is optimized to help you more easily submit orders that split the spread. Orders submitted within the bid/ask spread attempt to fill at a better price than the current NBBO - better than the ask for a buy order and better than the bid for a sell - and because they don’t immediately fill and take liquidity like market orders, may save exchange liquidity charges and even generate rebates for adding liquidity to the market as they work.
Adaptive Button
The Adaptive button lets you quickly submit an Adaptive order - designed to work for price improvement within the bid/ask spread - with a single click. Quickly cap the Adaptive order with a limit price using the Relative Price buttons or Relative Price Wand to create an Adaptive Limit order. Find out more about the IB Adaptive Algo.
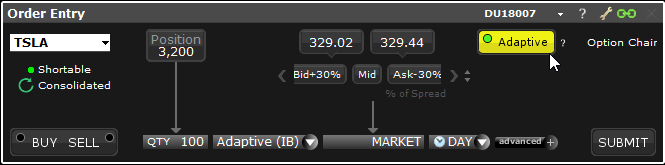
Price Slider with Relative Price Buttons
The current Mosaic Price Slider offers a visual method to quickly enter a limit price between the bid and ask prices with a single click. With this new release, the slider has been enhanced to provide three modes that can be accessed using the up/down buttons to the right of the slider.
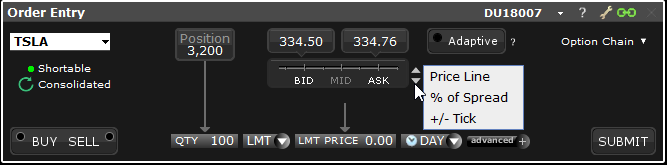
All modes offer easy price entry between the bid/ask spread:
- Price Line - The original slider with clickable BID/MID/ASK buttons
- % of Spread - Displays clickable relative price buttons that create a price based on the bid or ask plus or minus a percent of the spread, for example "Ask -30%. Available values are based on the spread at the time the tool was opened and will vary between instruments, and for the same instrument at different times if the spread changes.
- +/- Tick - Displays clickable relative price buttons based on the bid or ask plus or minus ticks, for example "Bid + 2."
The Relative Price buttons expand the functionality of the slider by providing an easy way to enter a limit price within the spread relative to the bid or ask price.
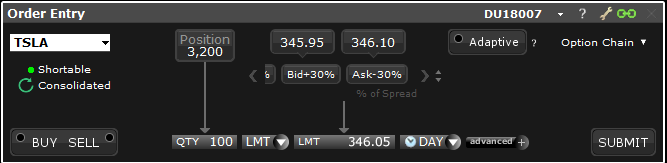
All price selections result in a one-time absolute order price that does not update regardless of market movement. When you select a relative price, (e.g. "Ask - 30%), the corresponding absolute price (346.05) is displayed in the Price field.
Relative Price Wand
The Relative Price Wand adds an additional panel to the existing price wand, with functionality identical to the Relative Price Buttons but laid out vertically and displaying a larger selection of prices. The Relative Price Wand is available throughout TWS wherever you can place an order, and is invoked by clicking the price field.
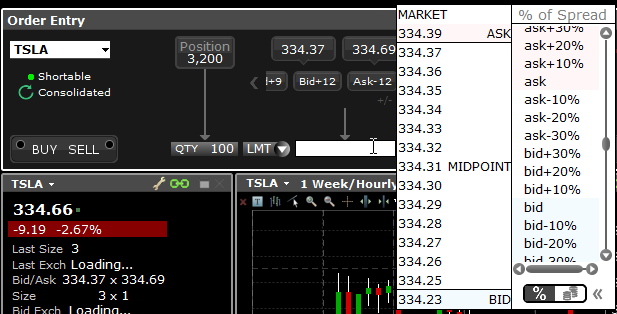
Toggle the view between percent of spread and tick increments using the icons at the bottom of the Relative Price list.
The Relative Price tools offer an alternative way to define a limit price for an order relative to the bid or ask price. Because relative price increments are calculated each time you open a relative price tool, the increments will vary between different instruments, and for the same instrument at different times. Increments are calculated using the instrument's minimum tick size and the width of the bid/ask spread at the time you open the display. Wider spreads result in more and smaller increments.
Calculating Relative Price Increments
The calculation for determining relative price increments is: Minimum tick size / spread x 100.
For example, for a US stock with a minimum tick size of 1 penny ($0.01) and spreads of 1, 2, 3, 4, and 5 ticks (0.01, 0.02, 0.03, 0.04, 0.05) the increments would be calculated like this:
1 tick: 0.01 / 0.01 x 100 = 100%
2 ticks: 0.01 / 0.02 x 100 = 50%
3 ticks: 0.01 / 0.03 x 100 = 33%
4 ticks: 0.01 / 0.04 x 100 = 25%
5 ticks: 0.01 / 0.05 x 100 = 20%
Applying Relative Prices
When you select a relative price, we calculate the absolute order price using the best bid or best ask price and the bid/ask spread at the time of the order. This means that the width of the spread used to determine price increments and the width of the spread used to calculate the absolute price could be different.
The calculation for determining the absolute price from the relative price is:
Price +/- (current width of the spread (as a percent) x relative increment (as a percent))
For example:
- If the current ask price is 346.10
- The current spread is 15 ticks
- The % increment is 30%, and
- You choose "ask - 30%" from the relative button or wand
The absolute price would be:
346.10 - (.15 x 0.30) = 346.05
As we improve the artificial intelligence that powers IBot, our first step was to revamp IBot's user interface to make it easier to apply machine learning, based on how you interact with it. Other improvements to the interface include:
- Better presentation of information. Key elements are easier to spot in the new design which uses the full screen instead of limiting commands to text bubbles.
- You can now use keyboard shortcuts like Ctrl + 1 (Windows) or Cmd +1 (Mac) to invoke an action.
- IBot's "next step" shortcut buttons are displayed vertically and are color-coded to help identify their function quickly ("Buy" buttons are blue, "Sell" buttons are red. All others are gray).
- The open interface allows for larger text display and more space for helpful graphics like charts and tables.
- When you enter a command, it now displays in the top right corner of IBot for easy reference.
- See previous commands using the scroll bar along the right side of the interface, or use the "Up" arrow on your keyboard (Windows).
Try out this improved version of IBot from the Mosaic New Window drop down by selecting IBot (Beta) - type to trade.
Find out more about IBot.
Effective with API version 973.04, you can now retrieve tick-by-tick historical data via the API using the function IBApi::EClient::reqHistoricalTicks, which corresponds to the TWS Time & Sales window.
For samples and more information, see http://interactivebrokers.github.io/tws-api/historical_time_and_sales.html.
In TWS 966 we added the Adaptive Algo shortcut button to the Mosaic Order Entry panel. Now we've added a useful set of drop down shortcuts to the Option Chain button. These shortcuts open the selected tool with the current Instrument Type as the focus. Shortcuts include Option Chain, BookTrader, Market Depth, Strategy Builder, Fundamentals, Time & Sales and Alerts.
To quickly access any of the above tools from the Mosaic Order Entry Panel, click the "down" arrow on the Option Chain button and make your selection. When you select a tool, the button label changes to reflect your selection. Note that if you click the button title itself, you will open the named tool. You will only see the drop down list if you click the down arrow.
We've added "Snap to Midpoint," "Snap to Market" and "Snap to Primary" orders to the Mosaic Order Entry panel. The Snap to Midpoint order is just one in our suite of advanced order types that can help you trade within the spread.
To use Snap to Midpoint and other "snap to" orders, use the LMT drop down list and select the order type.
Find out more about Snap to Midpoint orders. Other order types designed to help you trade within the spread include the Adaptive algo, Relative, Pegged-to-Midpoint, and Limit order. Visit the Order Types page to read more.
You can now view the historical midpoint for an expiry in the Implied Volatility Viewer. To see the historical midpoint, ensure that only one "Last Trading Day" is selected. In the "Days" section of the title use the "+" to select a historical period, for example 3 weeks. Right click in the graph and from the context menu select Historical Midpoint. You'll see the historical midpoint put and call values represented by triangles (downward-pointing for puts, upward for calls). See the associated value by holding your mouse over a triangle.
To open the Implied Volatility Viewer, from the New Window drop down select Options Analysis, then select Interactive Analytics and then Implied Volatility Viewer.
Build 966 - June 2017
Achieve the fastest fill at the best all-in price by using the Adaptive IB Algo, which adjusts to match market conditions. We made it easier to use the Adaptive IB Algo in Mosaic’s Order Entry.
Click the Adaptive button to activate Adaptive mode. Once active, you may choose to set a specific limit price, which results in an Adaptive Limit order, or leave the “MARKET” price, which produces an Adaptive Market order.
- Adaptive Market - For a buy order, a simple Market order hits the ask and fills, while an Adaptive Market order dynamically selects and varies the price in an effort to fill at the best all-in price.
- Adaptive Limit - Works similar to an Adaptive Market order, but uses the limit price as a price cap. The Adaptive Limit will only fill at the specified limit price or better.
If you don't see the Adaptive button in your Order Entry Panel, switch to Interactive mode. Click the configuration wrench icon, select Settings, choose Interactive as the Order Entry Tool Style and click OK.
Visit the Adaptive Algo order types page to find out more.
The current release includes several bug fixes including: presets that were not applied as expected for orders; the Trades summary feature that wasn’t loading correctly; incorrect display when switching the main window view to use the OS Window Bar.
Build 965 - May 2017
IBOT, TWS' natural language interface to trading, understands task-related requests and can perform many trading actions for you, like showing your current P&L, creating an order, setting up charts and scanners and much more. Now IBot can also help you search the IB web site for reference and "how to" information.
This integration lets IBot respond to such queries as "search for funding accounts" and "search: pricing and commissions" by returning the top five search results from IB's web site. We also include a link to "More results" in case you don't see exactly what you're looking for. Clicking a link will take you from the IBot interface to the selected page at IBKR.com. Using the terms "search for" or "search:" (search plus a colon) clearly indicate to IBot that you're looking for IB website information.
To use IBot, click the New Window drop down in Mosaic and select IBOT (beta) - type to trade. Enter a text request in the entry field, or click the microphone icon to speak the request into your PC's mic. To find out more, visit the IBot feature in focus page.
TWS for Desktop users can now use voice commands with IBot if a microphone is available. To use voice command, either click the microphone icon in the text entry box, or use the keyboard shortcut "ctrl + spacebar." When IBot is in listening mode, speak your command, which appears in text in the text entry box. To submit the verbal command, hit the space bar. To exit listening mode and cancel the command, press the ESC key.
Order Presets in TWS are used to specify often-used default order parameters, such as order type, order quantity, time and force and much more. Effective with Beta version 965, these user-defined default values that you specify in the Presets section of Global Configuration will now be available through the Cloud for use in TWS for Mobile orders. When applicable, active presets will automatically be applied to orders submitted from TWS for Mobile.
At this time, presets can only be modified in the desktop version, but the ability to modify presets in TWS for Mobile will be offered soon. To find out more about defining presets, see the TWS Users' Guide.
We now show you the total financial benefit you could realize from exercising a long option early, prior to its ex-dividend date. The benefit comes in terms of value saved by early exercise (vs.value lost if the option is held). Positions that offer a potential benefit will display a bright yellow zigzag icon next to them, both in your portfolio and in the Account window. To see the total potential benefit of early exercise, hold your mouse over the zigzag icon. Additionally, the Option Exercise window also now displays a Total Benefit column with the beneficial amount, when applicable. Access the Option Exercise window by clicking the link in the zigzag benefit message.
To learn more, see the article Considerations for Exercising Call Options Prior to Expiration in our knowledgebase. Find out more about option early exercise in the TWS Users’ Guide.
A new instrument category, US CDs, has been added to the Advanced Market Scanners. This category allows you to scan for corporate CDs and see them listed separately from US Corporate Bonds, where they were previously displayed.
To use Advanced Market Scanners from within Mosaic, from the New Window drop down select Advanced Market Scanner from the Technical Analytics section. Select US CDs from the Instrument list, and define filters. Click Search to run the scan. Click Edit to modify scan filters and parameters at any time.
From within the Classic layout, use the Analytical Tools menu and select Advanced Market Scanner. Select US CDs from the Instrument list, and define filters. Click Search to run the scan. Click Edit to modify scan filters and parameters at any time.
The below updates and fixes are included this beta release:
- New Field in IB Risk Navigator - You can now view an option's time value (option price - intrinsic value) by adding the "time value" field to your risk reports. To add this field, hold your mouse over a existing field and select "Insert Column." From the Contract Risk section, select time value. Note: To view the aggregated option Time Value per-position (position size x multiplier x (option price - intrinsic value)), add the Time Value field found in the Value columns section. Fields use upper and lower case names to distinguish aggregated position values (upper case) from single contract values (lower case).
- IB Gateway "Simulated Trading" Message - Clients using the simulated trading version of the IB Gateway will no longer receive the simulated confirmation message every time a running session is reconnected. The message will only be presented when a user first logs in to the IB Gateway.
Build 964 - March 2017
Easily find ETFs using the new ETF Market Scanner. Filter and scan 1400 US Equity and Fixed Income ETFs using more than 30 data points provided by AltaVista Research, including Assets Under Management, Expense Ratio, Year-to-date Performance, Developed Market Exposure, Payout, Forward Price/Cash Flow, Long Term Growth, Short Interest and many more. You can also view these data points as columns on any TWS tool, using the ETFs category.
For Equity ETFs, data points also include Book Value per Share, DPS, EPS, Net Margin, Price/Book Value, Price/Cash Flow, Price/Earnings, Price/Growth, Price/Sales, RoE, SPS, Dividend Yield and EPS Growth. Where relevant, data points support data for the previous, current and next fiscal year.
Mosaic Market Scanner: To use in Mosaic Market Scanners, from the Monitor panel click the "add tab" icon at the end of the tab list and select Mosaic Market Scanner. Click Create new custom scan and select ETF EQ (Equity ETFs) or ETF FI (Fixed Income ETFs) from the Universe. In the Fields & Filters section, click Add field and select the ETFs category to apply criteria.
Advanced Market Scanner: To use in the Advanced Market Scanners, from the Mosaic New Window drop down select Advanced Market Scanner. Choose US Equity ETFs or US Fixed Income ETFs as the instrument type then specify Locations, Filters and Parameters.
Columns: Add ETF-based columns to any tool by holding your mouse over an existing field header and selecting Insert Column. From the ETFs category select the column to add.
New technical market scanners and columns powered by Recognia Research are now available. Recognia’s pattern recognition technology identifies technical events that have formed over days, weeks, and even months which may indicate the trends over the short-, medium- and long-term horizons. Apply technical pattern scanning with other fundamental and technical data points to find the stocks that match your specified criteria. Recognia can recognize over 60 technical events such as Head and Shoulders, Breakouts, Shooting Stars, Hammers, Gravestones, Triangles, Flags, Pennants and more.
Mosaic Market Scanner: To use in the Mosaic Market Scanners, from the Mosaic New Window drop down select Mosaic Market Scanner. Click Create new custom scan and define the Universe. In the Fields & Filters section, click Add field and select the Technical Indicators by Recognia category to apply criteria.
Advanced Market Scanner: To use in the Advanced Market Scanners, from the Mosaic New Window drop down select Advanced Market Scanner. Choose US Stocks as the Instrument, select Locations and Filters, and from the Parameters scroll to select those labeled (Recognia), for example Long Term Event Score (Recognia) or Short Term Trade (Recognia).
Columns: Add Recognia Research-based columns to any tool by holding your mouse over an existing field header and selecting Insert Column. From the Technical Indicators by Recognia category select the column to add.
You must be subscribed to the Research Essentials subscription bundle to access Recognia scans and columns. To subscribe, log into Account Management and from the Manage Account menu select Trade Configuration and then select Research.
Use our convenient new note-taking feature, Trader's Journal, to record and save your trading ideas for any product in TWS. To open the Trader's Journal, use the New Window drop down and in the Information System section select Trader's Journal. For greatest convenience, use the push pin to make the journal stay on top of other applications, and set it up alongside your TWS layout.
Or, add a note on the fly to any asset by right-clicking the asset and selecting Add New Note. Enter a note in the editor. Add a snapshot of a chart or other tool by clicking the snapshot icon and selecting a tool from the drop down list. Notes are stored by symbol, and any symbol for which you have created a journal entry displays a paper sheet icon. Hold your mouse over an icon to read the note.
Notes are saved and will be available the next time you log into TWS.
Tell us how we can serve you better. Beginning with release 964, we've made it easy for you to send suggestions and feature requests to us at IB, all of which will be reviewed by our TWS development team. Simply click the "Feedback" button from the Mosaic anchor window, or select "Provide Feedback" from the TWS help menu to send your feedback.
The feedback feature is for enhancement and feature requests only. For defect requests, please reach out to IB Client Services. Please note that this button is being rolled out gradually. If you have a request but don't yet see this button, please submit your ideas through the Interactive Brokers Features Poll.
You can now ask IBot to add tickers to your watchlists. Simply select a watchlist from the Monitor panel and enter the command "Add ibkr to watchlist" and IBot adds the ticker to selected watchlist. Or, use the watchlist name, for example "Add ibkr to favorites" and IBot will add the ticker to your "Favorites" watchlist.
To use IBot, from the New Window drop-down in Mosaic select IBot (beta) - type to trade. In the IBot text box type your command. Type "demo" to see a short demonstration. To find out more, visit our IBot feature page.
Both the Mosaic Activity panel Trades window and the Classic Trade Log window can now be linked to other windows as a “Source” using windows color linking. This means that any instrument selected in these windows will be reflected in all other linked tools and windows (Destinations), but their content will not change based on instruments selected in other grouped windows. Hold your mouse over the chain link icon in the top right corner of any linked window to see whether the window is a source, destination, or both.
To link the Trades and Trade Log window to a group, click the colored chain link icon in the top right corner of the window, and from the drop-down list choose the colored group that matches the color of the windows group to which you want to link. Note that in Mosaic, you can link the Trades window to different groups in different layouts, for example you could link the window to Group 1 in the Mosaic layout, and to Group 4 in the Charts – Long Term layout.
We are now able to calculate a more accurate quote for multi-leg combinations data that is frozen (after-hours) or delayed.
The Implied Volatility Viewer, accessed from the New Window drop down by selecting Option Analysis > Interactive Analytics > Implied Volatility Viewer now lets enable mouse-over highlighting for the volatility curves. This feature highlights the curve that your mouse is over, making it easier to see curves that may use a lighter gradient color.
To enable mouse-over highlighting for volatility curves, click the Configuration wrench icon in the title pane, and check Highlight curves on mouse hovering.
Build 963 - February 2017
IBot, our natural language trading interface, now supports calendar-related trading commands. Ask to see economic and corporate events, such as: "show upcoming dividends for companies in my portfolio” or “show economic events for companies in my watchlist and portfolio” and “are there any earnings announcements scheduled this week for companies in my portfolio?" In addition to calendar-related commands, IBot understands commands relating to quotes, charts, trades, orders, closing positions, your account, market scanner, option chain, Level II depth and "help." You can watch the demo by typing "demo" into the entry line.
Remember that you can use IBot with voice commands from your TWS for iPhone (running iOS version 10 or later).
To find out more, see the IBot Feature in Focus page.
You can have the system calculate the order quantity for Forex orders based on a monetary value that you specify. To use this “Cash Quantity” feature, click the Quantity field in the Order Entry panel or on a Classic order line, and toggle the quantity from the default currency to the alternate currency. For example, if the forex pair you’re trading is EUR.USD, the default currency is EUR. When you toggle to the alternate currency, in this case USD, the value will default to the equivalent monetary value based on the current exchange rate. When you submit the order, the system will attempt to buy or sell a quantity based on the amount you want to spend/receive.
Because the price may move before the order fills, we apply a “Cash Quantity Estimate Factor” when calculating the order quantity. This factor, set at 25% by default, increases the calculated order quantity to try to achieve the desired monetary outcome in cases where the price drops (for a buy order) or rises (for a sell order) by allowing more units to be bought or sold. You can change the estimate factor in the Size section of the Forex Preset in Global Configuration.
A new Consolidated button has been added to Mosaic and Classic views. This button is displayed when a US equity product is selected, and when clicked it shows a consolidated market data view for the selected instrument.
Within Mosaic, the button displays in the Order Entry panel when an eligible product is selected. When clicked, attention is brought to the Quote Details tile if that is included in the layout; otherwise, a small consolidated quote box appears and shows the last price, the change, the last size and exchange and more.
In Classic view, selecting an eligible product displays the Consolidated button in the new Ticker Action field. When clicked, the consolidated quote box appears and shows the last price, the change, the last size and exchange, and more.
Beginning in early February, this button will take on an addition role as the "snapshot" button. To expand our data offerings and allow greater customization, clients will have the option to receive streaming data from one, two or all three of the official tapes at the full monthly rate, or receive delayed data along with the ability to see "snapshot" quotes from these services at 0.01 USD (or equivalent) per snapshot, capped at the monthly streaming service rate.
Prior to this change taking effect, clients will receive a communication from IB explaining the transition in detail.
We have fixed several dividend- and display-related bugs.
2016
Build 962 - December 2016
IBot, our text interface to trading, now supports more trading commands to make him even more helpful. New areas of understanding include market scanners, option chains and Level II market data. Now IBot can help you with queries like “Show me today’s biggest gainers and losers on Nasdaq” or “Show option chain for aapl” or “level 2 depth for amzn.”
To use IBot, from the New Window dropdown in Mosaic select “IBot (Beta) – type to trade.” Enter a text query in the box at the bottom of IBot and hit Enter to send. IBot returns the results. In addition to understanding market scanner, option chain and Level II depth queries, IBot also responds to commands relating to quotes, charts, trades, orders, close position, account and help. Type “demo” into the query field to see a brief interactive overview of IBot’s abilities.
To find out more, see the IBot Feature in Focus page.
We've added a new column for options positions called " Portfolio Time Value: Calculated as (time value * position), this value shows option positions that have a premium in excess of the intrinsic value. Generally, the longer the time to expiration the greater the time value. Add this column from the "Option" category of columns.
To add a column, hold your cursor over an existing column and select "Insert Column."
We've renamed the TWS "Contract" column to "Financial Instrument" to more accurately reflect the potential contents of this field, which may include not only options and futures contracts, but also stocks, forex and other financial instruments.
Build 961 - December 2016
The default Mosaic workspace layout includes various trading tools for market data, order management, and news and analytics all in a single frame. It allows you to trade most instruments and is a great place to start, but you can also customize your workspace by creating trading layouts comprising the tools you use most. Layouts appear as named tabs along the bottom of TWS, making it easy for you to toggle between layouts with a single click.
To help you customize your workspace, we offer a Layout Library. Simply peruse and select a layout, for example "Option Trading" or "Futures Spreads" to add it to your workspace. Use the layout as-is, or unlock and edit it to make it your own. You can add, remove and resize tools, and use windows linking to connect tools by asset. Modify background and font colors, included fields and the order of fields on most windows.
To create a new layout, click the Add Tab "+" sign at the end of the tabset along the bottom of the Mosaic. Click Open Layout Library on the right side of the Add Tab dialog box. Browse layouts. Click Details to see more information; click Add Layout to create the layout. Alternatively, create a layout from scratch by entering the name of your new custom layout on the left side of the dialog box.
Toggle between your layouts by simply clicking the correct tab on the bottom of the frame.

We've taken the Thomson Reuters Street Events data, which was previously displayed on separate pages in the Events Calendar section, and combined all of it into a unified "Calendars" interface with multiple, filterable sections.
To view the unified Calendar, click the Event Calendar button in the Mosaic Anchor window. The left side of the display provides filters to streamline the displayed data shown on the right. By default the view opens to today's date, but you can click any date on the calendar widget to view events for that day. Other filters include:
- Filter by Company: Enter a symbol to filter out all data but for the specified company.
- Only Show My Companies
- If on, companies displayed in the individual sections are in your portfolio, a Watchlist, were recently held by you, or are competitor companies of these. Filter further by unchecking any of the four "my companies" selections.
- If off, you will see full data from Thomson Reuters.
- Corporate Actions
- If on, all four sections of the Corporate Actions umbrella are displayed. Filter further by unchecking one or more of the Corporate Action sub-categories.
- Corporate Events - Toggle on or off to display or hide Corporate Events.
- Economic Events - Toggle on or off to display or hide Economic Events.
- Option Last Trade Dates - Toggle on or off to display or hide the Option Last Trade Dates section.
- Region - Use the drop down selector box to view data for US, America Non-US, Europe, Asia, or all regions.
The results of your filters are displayed in the large frame on the right side of the Calendars window. Use the DAY/WEEK/MONTH buttons on the top right to view results for the selected day, week, or month. Events shown in weekly or monthly view are identified by colored dots. Use the calendar widget in the Filter section to select a different day, week or month.
We continue to provide more user customization throughout TWS. The Option Selector window, Option Chain and OptionTrader now provide two different display types: List View and Tabbed View. Both views display Calls on the left and puts on the right and both show the strike price in the center column. The List View additionally shows the contract description and days to expiration in the center column. The Tabbed View shows this information in each individual tab header. You can easily switch between views using the View dropdown list.
Also specify the number of strikes or specific strikes and the standard deviations in the Strikes drop down; the exchange or multiple exchanges in the Smart drop down; and the trading class or multiple trading classes (when valid) in the symbol dropdown. TWS remembers the last view you selected and will open it the next time you use the tool.
You can now add the Portfolio Performance Profile tool to a layout as an independent window. Previously, this tool was only available as a sidecar off your Mosaic Portfolio page. The Portfolio Performance Profile window lets you compare your portfolio's performance to that of a relevant benchmark and see how key portfolio metrics may change relative to moves in the benchmark. You can select a benchmark index from the drop down list in the title bar of the window.
To add the Portfolio Performance Profile window to a layout, select if from the New Window drop down list.
You can now hide the pop-up P&L calculation explanation that displays when you hold your mouse over a value in the P&L column. The information displays in a large pop-up box and shows current P&L as of the current time, P&L as of 5 minutes before midnight, and Net Traded amount since midnight.
To hide the pop-up, you can check the "Don't show this popup text again" checkbox in the actual message, or go into Global Configuration and from the Display>Settings page uncheck "Show calculations for P&L columns" in the Tooltips section of the Settings page.
Clients who trade Muni bonds and have CUSIP data permissions will now be able to link to Lumesis DIVER Advisor Municipal Bond Reports directly from within TWS. Bond reports provide a comprehensive overview for the selected municipal bond, including terms and features, redemption information, ratings, defaults and news and much more.
To view Lumesis bond reports from a muni bond data line, right-click the bond and select Contract Info and then Lumesis Bond Details. From within the Classic layout, you can also click the Bond Report button that displays in the new Bond Report column. Note that this beta feature may not be visible immediately as it is being rolled out to clients gradually over the next week.
To enhance platform resilience in cases where internet service has been compromised, we have added a new field to the TWS and IB Gateway login box, Name Resolution, which allows you to bypass the normal DNS system you use when logging in, and access internal mapping instead. This will allow you to log into and trade your IB account even when normal internet access is impaired.
To use this emergency feature, from the Login box click the "More options" link in the bottom left corner to expand the interface. From the Name Resolution box select IB Only. This process should only be used when needed as it will result some non-essential services, for example Risk Analytics, being unavailable.
Build 959 - October 2016
IBot is TWS' new text-based interface helps you complete key trading tasks without having to navigate anywhere else. IBot's text entry field accepts commands you enter in plain English, and responds by presenting you with the data or information you requested. Get quote details, create and submit orders, look at account values, open a chart and much, much more, all from the convenience of IBot's intuitive interface.
To open IBot, click the Mosaic New Window drop down and select IBot (Beta) - type to trade. IBot opens and presents some helpful tips. Use the white text entry box at the bottom of IBot to enter a command and then press Enter. Enter commands like "Show the last price for AAPL" "Buy 500 TSLA at 196" or "What's my current P&L?"
IBot currently supports commands related to: Quotes, Charts, Orders, Closing Positions, Trades, your account, and Company Fundamentals. Additionally, you can modify commands, for example you could say "Change that order to a market order" or "Change to a line chart." You can also find help by typing something like "Help with orders" or "Help with charts" and you can get Customer Service contact information using a command like "customer service" or "customer support."
For some useful tips, type "Demo" into IBot's text field and watch a short interactive overview. To find out more, visit the IBot Feature in Focus page.
Currently TWS uses a "0" in front of numbers that begin with a decimal point, for example 0.25, to help distinguish the starting decimal. To conserve space, we let you configure TWS to remove the leading "0" before all decimal points. With this feature enabled, a price would display as ".25" instead of "0.25". To remove the leading zero, go to Global Configuration and from the Display > Ticker Row Settings page check Remove leading zero before decimal point.
Cells in TWS that will initiate an action when clicked, for example the Bid and Ask prices in a Quote Monitor, now display a thin, white border when you mouse over them to indicate clicking will result in some kind of action.
You can now search for accounts and strategies from the Account drop down selector, which is displayed in the top frame of the Mosaic Order Entry panel and from the order line in the Classic layout. Click the down button to display the list of accounts and strategies, and use the search field at the top of this list to quickly find what you're looking for.
Build 958 - September 2016
A new P&L time zone setting, Use instrument-specific reset time, resets the daily P&L on a per-instrument basis in accordance with the time zone in which the instrument trades. Using instrument-specific reset times helps to ensure that the P&L calculation is consistent across all instruments, regardless of their region and time zone.
For instruments that open and close on the same day, the P&L is reset five minutes before midnight of the instrument's time zone. For instruments that trade across two days (through midnight), the P&L is reset five minutes before it opens for trading in the instrument's time zone.
This feature is enabled by default. To disable it, open Global Configuration from the Mosaic File menu, and on the General page de-select Use instrument-specific reset time in the P&L Time Zone section.
In our TWS news headlines, we have now combined the Sentiment and Confidence ranking data from Alexandria Contextual Text Analyticsâ„¢ Engine (ACTAâ„¢) into a single column called Rank. The column uses color along with a number to indicate a positive or negative sentiment.
Green indicates a positive ranking and can have a value between 0 and 1. Red indicates a negative ranking with a value between -1 and 0. Gradations of ranking indicate the degree of confidence in the sentiment. For example a positive ranking of 1 would indicate more confidence in the sentiment than a positive ranking of 0.65. If the Rank field is empty, the article has not been ranked, and a notation of "n/a" indicates neither positive nor negative sentiment.
Additionally, many headlines now include the sentiment in the headline after the symbol, for example, "12:13 SS XYZ Positive - Company XYZ Price Target Raised to $120." Also, many articles have the sentiment appended to the end when you select a headline to open the full article.
To find out more about Alexandria Technology's proprietary ACTA methodology,visit their website. Sentiment ranking is shown in both desktop and mobile versions of TWS.
Last September in TWS release 953 we introduced a new version of the Mosaic Order Entry panel redesigned to speed up the price entry process by providing one-click Bid/Mid/Ask price entry. We have now added this efficient order entry feature to other tools, including the Strategy Builder, Probability Lab and Option Strategy Lab. Quickly modify the price of any asset or complex combination using this simple one-click price entry system.
In 957 we introduced the ability to define a time zone for Daily P&L that could be different from your system time zone. For most products, we now calculate Daily P&L based on the price at the beginning of the day, which is midnight of the specified P&L time zone, instead of from the previous day's close. This calculation more accurately reflects changes in profit and loss, especially for products that trade semi-continuously, like Gold futures.
You can now see the P&L Time Zone in the Daily P&L display on your Portfolio page. Click the down arrow next to the time display to see a specifics of the P&L time zone, and to quickly access Global Configuration to make changes if needed. Additionally, mouse over the Daily P&L value for any position to see the "as of" details for right now and at the start of the day in your selected time zone.
Build 957 - July 2016
Earlier this year we introduced the Ichimoku Cloud chart indicator. We have now improved on this indicator by adding support for forward projection. This indicator shows an overall upward trend when prices are above the "cloud," a downward trend when prices are below it, and a flat trend when prices are inside the boundaries of the cloud.
To use Chart Indicators, click the Edit button within a chart and select Studies.
Earlier this year we introduced the Adaptive Algo which adapts to market conditions while attempting to achieve the fastest fill at the best all-in price. This innovative algo is now available for futures trades as well as stock and options.
You can now use TWS windows color grouping to link the Rapid Order Entry panel with other windows, for example an occurrence of the Integrated Stock Window, so that when you enter a contract in the Rapid Order Entry panel it will display in the linked ISW window.
To link windows, from the top right corner of a Quote Monitor use the drop down arrow next to the Configure wrench icon to display a selection list, and select "Group windows." Then, choose a colored group. From the window you want to link, for example the ISW, select the Group icon in the top right corner of the window and then choose the same colored group. Your two windows are now linked, and the Quote Monitor is a "source," which means it drives the symbol changes to identically-linked "destinations" such as the ISW. So if you change a stock symbol in the linked Rapid Order Entry panel (or if you just select another stock symbol from that linked Quote Monitor), the linked ISW tool will also update to show the newly selected symbol.
You can now specify a time zone that will be used only for Daily P&L, specifically to define "start of day" for Daily P&L calculations. This could be helpful if the assets you trade are in a different time zone from that in which you live. This time zone setting is separate from the system time zone that you can define in the Login box and changing the P&L Time Zone will not affect your system time zone. The P&L time zone is also used for triggering Daily P&L alerts.
To change the P&L Time Zone, open the General page of Global Configuration. In the P&L Time Zone section, elect to "Use specific time zone" and then select one from the drop down list. You must restart TWS for this setting to take effect.
You can now elect to close just one side of a multi-leg option spread that has more than two legs, for example an Iron Condor or Box, using the right-click menu in your portfolio. We have added two new buttons to the action menu, to "Close Combo Calls" or "Close Combo Puts."
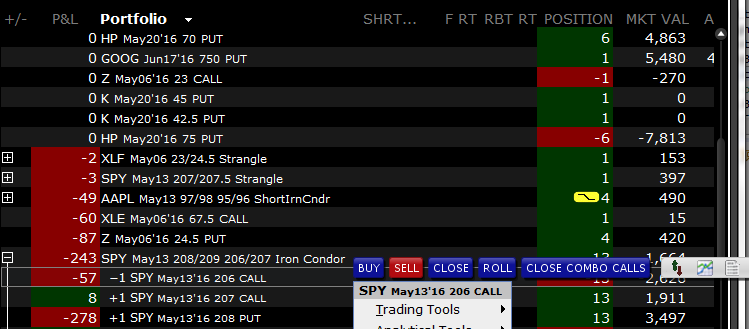
To use this feature, in your portfolio select either a call or put leg from the spread and use the right-click menu to select the appropriate Close button. The Close Combo window will display showing the same side legs from the spread. Modify the order as needed and click Submit to close the call or put side of your complex multi-leg strategy.
We are working to provide more ways to let you configure your trading platform to specifically meet your needs. Our latest series of customization improvements (there are more to come!) include:
- The ability to add many predefined multi-tiled tools (such as the Probability and Option Strategy labs) as new layout tabs along the the bottom of your platform frame. To do this, find the tool in the New Window drop down list and slide to the right of the tool name to select the "Add as new tab" icon. Once it's added you'll see it tabbed along the bottom with the Mosaic, Classic TWS and any other workspace tabs. And remember - you can add new "tiles" to these multi-tiled labs. For example, you might want to put the Order Entry tile into the Probability Lab.
- You can now include the Rebalance window, BasketTrader and ScaleTrader tools as tiles in any workspace container (previously these could only be opened as stand-alone tools).
- We've fine-tuned the Analyst Research windows to behave better when you use them as tiles in a workspace container.
- Multi-account users will now see the account selector displayed more prominently in the Order Entry panel.
You can now instruct TWS to filter out some of the asset types that display in the selection list when you add a product to a trading tool and hit 'Enter.' By default we display all available product types for the entry. The new Contract Selector configuration page in the Display section of Global Configuration allows you to customize your product universe by "hiding" asset types you don't use often. All instrument types are still available to use by pressing Alt+Enter after you enter a symbol.
To filter out products, from the Mosaic File menu select Global Configuration. In the left pane of Global Configuration expand the Display section and choose Contract Selector. Check "Use user-defined product universe" to enable filtering. Check Bypass Product Selection List to have the system auto-populate a market data line once you enter the symbol (without displaying any list). Use the checkboxes to select the product types within the exchanges and exchange groups. You can modify this selection at any time.
We have nearly doubled the number of available filters and sorting criteria in the Portfolio Builder by adding over 40 new Reuters data points. These can also be added as columns in your Mosaic and Classic tools and windows. These new data point are named in the New Data Points section below.
Additionally, five data points that were already available as TWS columns have been added as new filters in the Portfolio Builder. Access them from the Add Additional Filters drop down. Four are in the Fundamentals - Per Share Data section. They are: Tangible Book Value per share, Cash Flow per share, Earnings per share Excluding Extraordinary Items and Revenue per Share. One is in the Fundamentals - Popular section: Shares outstanding.
Some existing filters/columns have been moved from their original group to a new group.
The below have been moved from the Fundamentals Other group to Fundamentals Per Share Data
- Book Value (tangible) per share
- Cash Flow per share
- Cash per share
- Free Cash Flow per share TTM
- Price to Cash Flow per share
- Price to Free Cash Flow per share TTM
- Revenue/share
The below have been moved from the Fundamentals Other group to Fundamentals Statements/Balance Sheet
- EPS Change TTM %
- Earnings before taxes
- Return on average assets %
- Return on investment %
New data points
New data points are listed below according sorted by the groups in which they can be found. These can be used as filters and sorting criteria in the Portfolio Builder and also as new fields on TWS and Mosaic tools and windows.
High/Low/Volume/History
- 1w Change % - One week change in price expressed as a percent.
- 4w Change% - Four week change in price expressed as a percent.
- 13w Change% - Thirteen week change in price expressed as a percent.
- 52w Change % - Fifty-two week change in price expressed as a percent.
Fundamentals Per Share Data
- Cash Flow per share MRY
- Price to Cash Flow per share MRQ
- Revenue/share - MRY
Fundamentals Statement/Balance Sheet
- Capital expenditure - MRQ - Capital expenditure for the most recent interim period.
- Capital expenditure - MRY - Capital expenditure for the most recent fiscal year.
- Cash and short term investments - MRQ - Cash and short term investments for the most recent interim period.
- Cash from operating activities - MRQ - Cash from operating activities from the most recent interim period.
- Cash from operating activities - MRY - Cash from operating activities from the most recent fiscal year.
- EBIT - MRQ - Earnings before interest and tax for the most recent interim period. Computed as total revenue - total operating expenses + operating interest expense for this same period, excluding non-operating income and expenses. Only available for utility and industrial companies.
- EBIT - MRY - Earnings before interest and tax for the most recent interim period. Computed as total revenue - total operating expenses + operating interest expense for this same period, excluding non-operating income and expenses. Only available for utility and industrial companies.
- EBITD - MRQ - Earnings before interest, taxes, depreciation and amortization is the EBIT for most recent interim period + depreciation and amortization expenses (from the statement of Cash Flows) over the same TTM period. Only available for utility and industrial companies.
- EPS excluding extraordinary items - MRY - Calculated as the adjusted income available for common stockholders for the most recent fiscal year / the most recent fiscal year's diluted weighted average shares outstanding.
- Financing cash flow items - MRQ - Financing cash flow items for the most recent interim period.
- Financing cash flow items - MRY - Financing cash flow items for the most recent fiscal year.
- Interest exp. (inc.), net-operating - MRQ - The total operating and nonoperating income expense for the most recent interim period. NOTE: Not Meaningful (NM) for banks and insurance companies.
- Interest exp. (inc.), net-operating - MRY - The total operating and non-operating income expense for the most recent fiscal period. NOTE: Not Meaningful (NM) for banks and insurance companies.
- Investing cash flow items - MRQ - Investing cash flow items for the most recent interim period.
- Investing cash flow items - MRY - Investing cash flow items for the most recent fiscal year.
- Net issuance of debt - MRQ - Net issuance of debt for the most recent interim period.
- Net issuance of debt - MRY - Net issuance of debt for the most recent fiscal period.
- Net issuance of stock - MRQ - Net issuance of stock for the most recent interim period.
- Net issuance of stock - MRY - Net issuance of stock for the most recent fiscal period.
- Notes payable/short term debt - MRQ - Notes payable/short term debt for the most recent interim period.
- Notes payable/short term debt - MRY - Notes payable/short term debt for the most recent fiscal year.
- Operating income - MRQ - The amount of profit realized by a business after deducting its operating expenses over the most recent interim period.
- Operating income - MRY - The amount of profit realized by a business after deducting its operating expenses over the most recent fiscal year.
- Return on average assets - MRY % - Income after taxes for the trailing twelve months /average total assets expressed as a percentage. Average total assets is calculated by adding the total assets for the five most recent quarters and dividing by 5.
- Return on investment - MRY % - The trailing twelve months Income after Taxes / Average Total Long Term Debt, Other Long Term Liabilities and Shareholder Equity, expressed as a percentage.
- Total assets - MRQ - Total assets for the most recent interim period.
- Total common equity - MRQ - Total common equity for the most recent interim period.
- Total current assets - MRQ - Total current assets for the most recent interim period.
- Total current assets - MRY - Total current assets for the most recent fiscal year.
- Total current liabilities - MRQ - Total current liabilities for the most recent interim period.
- Total current liabilities - MRY - Total current liabilities for the most recent fiscal year.
- Total liabilities - MRQ - Total liabilities for the most recent interim period.
- Total long-term debt - MRQ - Total long-term debt for the most recent interim period.
Fundamentals Other
- Enterprise Value to EBITDA - TTM
- Price to revenues - MRQ
- Dividend Yield
You can now add and remove IB Algos from the "Favorites" list, which promotes the selected algo to the list of order types in the Mosaic order panel, along with the non-algo order types like limit, market, stop and others. When algos are not tagged as favorites, you need to click through one more list level within the order types to open the IBALGO section.
To manage IB Algos in Global Configuration, from the Mosaic File menu select Global Configuration. In the left pane, choose Orders and then choose IBALGO. Check to add algos to favorites, uncheck to remove.
Note that the Smart Routing configuration section has also been moved under the Orders section.
You can now modify the order type for multiple orders, for example a basket of orders, from the existing order type to any other supported order type or algo. Previously, only a change from limit to market was supported for mass changes. and other types that were considered non-compliant would be skipped. This means you would have had to manually cancel and re-create working orders if you wanted to change the order type to anything other than limit or market, or if you wanted to modify the type of algo you originally selected.
To use this powerful feature from within BasketTrader, load the basket file, and from the Edit menu select Update Orders. In the Update Orders dialog box, elect whether to update all, selected, inactive or open orders, and from the Order Type field for regular orders or the Stock Algorithm section for algo orders, select the new order type.
For many supported IBALGOS, you can now determine the order quantity by entering the cash amount you want to spend. The order quantity will be calculated based on the "cash quantity" that you specify.
A new configuration setting for the Rapid Order Entry panel allows you to override default order values for stocks, such as side (buy or sell), quantity and time in force, and instead save and use the last order values you specified for an order. For example, if you have the default order quantity for stock set to 500 and you use Rapid Order Entry to submit a stock order with the quantity changed to 1000, 1000 will become the new default stock order size for orders entered in Rapid Order Entry. If you change the size on your next Rapid Order Entry order from 1000 to 200, you will now have 200 as the new default size.
To use the Rapid Order Entry panel, select the drop down arrow next to the configuration Wrench icon in the right corner of a trading page and select Rapid Order Entry. To enable this new setting, click the configuration Wrench icon in the Rapid Order Entry panel and in the Miscellaneous section check "Save order info."
Build 956 - April 2016
You can now enable fields within Risk Navigator to view risk specifically for Model Portfolios (for Advisors and Multi-Client accounts), Account Partitions or Portfolio Builder strategies (for individual trader or investor accounts)within the risk reports. To view activity for these feature, from within the Risk Navigator use the Dimensions menu to select the desired display field.
Additionally, we have added three new columns to the Risk Navigator tabs, along with the ability to use different "margin" modes in a hypothetical what-if portfolio.
New columns are available from the Metrics menu and include:
- Tracking Factor - Available in the Contract Risk category, this field will provide the related tracking factor if the contract has a related primary contract, i.e. leveraged ETFs. You can add this column to the Equity, Forex, Commodity, MoneyMarket and Volatility Products tabs.
- Correlation - Available from the Beta Risk category, this field provides the correlation between the a contracted and the user-selected reference index. You can add this column to the Equity, Forex, Commodity, MoneyMarket and Volatility Products tabs.
- Description - Available from the Descriptive Columns category, the field provides the 'company name' details for a contract. You can add this column to the Equity, Bond, Forex, Commodity, MoneyMarket, Structured Products, Volatility Products and P&L tabs.
To support viewing a what-if portfolio in different margin scenarios, we have added a new Margin Mode feature to the Risk Navigator Settings menu. This feature is only available for what-if portfolios, and will be greyed out if the server does not find at least one available other margin type. Click Margin Mode, and then select a new margin to apply. The active margin is displayed in the bottom right corner of the what-if portfolio window.
You can now customize how dates are formatted and displayed throughout TWS using the Date Formats page. Select the order of units, for example Month/Day/Year or Year/Month/Day etc. Specify how the year and month is formatted, and even tell the system whether or not to leave a space between the month and day, for example MAR16, or MAR 16, and to omit showing the year if it's the current year.
Set the Date Format at the global level to apply across all areas, or make your settings more granular by setting different layouts specifically for different displays, such as the Contract Month, Last Trading Day and Contract Description. A drop-down label for each of these categories lets you specify whether to use the Global date formatting, or the unique settings for that section.
To modify Date Formats, open Global Configuration and from the Display section select Date Formats. Note that these changes are applied immediately when you hit "OK" or "Apply"; there is no need to restart TWS.
You can now set up an alert that istriggered when your account's Daily P&L reaches a specified USD value.
To create a Daily P&L alert, use the right-click menu from any instrument to select Analytical Tools and then Alert, or use the quick-click button menu to select the Alert bell icon. Click Advanced Settings in the Configure Price Conditions box to and then select Daily P&L. Define the operator and P&L value and click "Finish" then use the Alerts interface to set up how you want to be notified and to "Activate" the alert. Note that alerts are stored in the cloud, and will remain active regardless of whether or not you are logged in to TWS.
We have added a group of real time Advanced Market Scanners for product-based EMAs, price crossing EMAs, or EMA(20) crossing EMA(200). For these scanners we support 20, 50, 100, and 200 period EMAs.
New Market Scanners are available as Advanced Market Scanners, and all EMA and Price/EMA are available in Mosaic Market Scanners. Scanners currently include:
- EMA (ascending and descending sort), for 20, 50, 100 and 200 period EMAS.
- Price/EMA (ascending and descending sort) for 20, 50, 100 and 200 period EMAS, calculated using (Last Price EMA)/EMA.
- Bullish Price/EMA for 20, 50, 100, 200 period EMAs calculated using (Last Price EMA)/EMA but only shows items where yesterday's value was on the other side.
- Bearing Price/EMA for 20, 50, 100, 200 period EMAs calculated using (Last Price EMA)/EMA but only shows items where yesterday's value was on the other side.
- Bullish Price EMA (20)/EMA (200) calculated using (EMA (20) EMA (200))/Last Price, but only shows items where yesterday's value was on the other side.
- Bearing Price EMA (20)/EMA (200) calculated using (EMA (20) EMA (200))/Last Price, but only shows items where yesterday's value was on the other side.
To add an Advanced Market Scanner, use the Classic TWS interface and from the Analytics Menu select Advanced Market Scanner. To use Mosaic Market Scanners, from the Mosaic Monitor panel click the "Add Tab" icon and select Mosaic Market Scanner.
These data points (including divergence percentages) are also available as columns so that you can see these values for products in watchlists and portfolios, and in any other tools we offer.
Columns currently include:
- EMA (100): 100-period Exponential Moving Average.
- EMA (100) Crossover: 100-period Exponential Moving Average crossover, shown as a percentage.
- EMA (20): 20-period Exponential Moving Average.
- EMA (20) Crossover: 20-period Exponential Moving Average crossover, shown as a percentage.
- EMA (20)/EMA (200): 20-period Exponential Moving Average over 200-period Exponential Moving Average, shown as a percentage.
- EMA (200): 200-period Exponential Moving Average.
- EMA (200): Crossover 200-period Exponential Moving Average crossover, shown as a percentage.
- EMA (50): 50-period Exponential Moving Average.
- EMA (50) Crossover 50-period Exponential Moving Average crossover, shown as a percentage.
- MACD Moving Average Convergence/Divergence.
- MACD Histogram - Moving Average Convergence/Divergence histogram.
- MACD Signal Line - Moving Average Convergence/Divergence signal.
- PPO Percent of Price Oscillator, shown as a percentage.
- PPO Histogram - Percent of Price Oscillator histogram, shown as a percentage.
- PPO Signal Line - Percent of Price Oscillator signal line, shown as a percentage.
- Price/EMA (100) 1:1 ratio of price to 100-period Exponential Moving Average.
- Price/EMA (20) - 1:1 ratio of price to 20-period Exponential Moving Average.
- Price/EMA (200) - 1:1 ratio of price to 200-period Exponential Moving Average.
- Price/EMA (50) - 1:1 ratio of price to 50-period Exponential Moving Average.
Note that the values for all ratio-style columns, such as "Price/EMA (20)", are shown in % terms of the denominator. So a value of "5%" would indicate that the price is 5% higher than the EMA (20).
To add these columns to a Watchlist or other window, hold your mouse over an existing data column to display the "Insert Column" feature. Click "Insert Column" and select columns from the Technical Indicator category.
When clients create strategies using the Portfolio Builder, the portion of their portfolio that isn't allotted to these model strategies is called the independent segment. Users who want to decrease a position or fully divest a model can now elect to use existing positions in the Independent segment to satisfy the transaction when possible. Choosing this option allows you to decrease or close out a model without creating exchange orders with commissions and other fees. For example, if you're short 1000 XYZ in your independent portfolio and would like to close your long position of 500 XYZ in a model, you can elect to cross the model's closing order with the short position and end up with a net 500 short position, without incurring any commissions. In cases where the independent segment position cannot close or fully close the model position(s) - i.e. if the model in the previous example was long 1500 - an order for the remainder, in this case an order to sell 500 shares of XYZ, will be created.
To make this choice, select "Cross closing orders with Independent segment" when asked how to divest the model or reduce positions.
A new Global Configuration setting allows you to always send an email/SMS message to the device set up in Account Management when you set an alert. Currently, you need to specify an email/SMS message manually for each alert you set.
To have the "send message" feature activated by default for all alerts, open Global Configuration and in the Information Tools section select Alerts and then select Settings. Check the "Send message via e-mail or SMS" checkbox. Note that you can disable this message on a per-alert basis on the Message tab within the Alert.
The Contract Description field will now display content in the localized language set in TWS, when available. Currently, only Simplified Chinese is supported. Change the display language for TWS in the Login Box by clicking the flag icon along the bottom of the box and then choosing a language.
Several new tags have been added to the reqAccountSummary method:
- $LEDGER - Single flag to relay all cash balance tags*, only in base currency.
- $LEDGER:CURRENCY - Single flag to relay all cash balance tags*, only in the specified currency.
- $LEDGER:ALL - Single flag to relay all cash balance tags* in all currencies.
* Cash balance tags include: Currency, CashBalance, TotalCashBalance, AccruedCash, StockMarketValue, OptionMarketValue, FutureOptionValue, FuturesPnL, NetLiquidationByCurrency, UnrealizedPnL, RealizedPnL, ExchangeRate, FundValue, NetDividend, MutualFundValue, MoneyMarketFundValue, CorporateBondValue, TBondValue, TBillValue, WarrantValue, FxCashBalance, AccountOrGroup, RealCurrency, IssuerOptionValue
Build 955 - February 2016
Use Portfolio Builder to create hypothetical investment strategies based on top-tier research and fundamentals data, back-test and adjust as needed and then invest in the strategy and tracks its performance within your existing portfolio. To help you get started, we've added several thoughtful, predesigned strategy templates that you can customize as desired. When you open Portfolio Builder from the New Window dropdown, you'll see the Predefined Strategies in the sidecar Library. Click a strategy to get started, and then click the "Customize" button to make changes.
Current strategy templates include:
Closely Held - The universe of equities for this strategy includes stocks that have strong balance sheets (where Total Long Term Debt/Total Shareholder equity for most recent period is under 50) and high insider ownership (over 20%), and is sorted based on equally-weighted ratings from all analysts. After sorting, the 10 highest-ranked of these stocks comprise the long portion of the portfolio, and the 10 lowest-ranked comprise the short portion. The investment amount you allot to the strategy is allocated using a long/short ratio of 130%/50%, and is set to rebalance monthly.
Growth - The universe of equities for this strategy includes stocks that are regarded as "Growth" stocks (with an Earnings Per Share change over the last 12 months greater than 5%) at attractive valuations (price-to-earnings ratio under 12), and is sorted based on equally-weighted ratings from all analysts. After sorting, the 10 highest-ranked of these stocks comprise the long portion of the portfolio, and the 10 lowest-ranked comprise the short portion. The investment amount you allot to the strategy is allocated using a long/short ratio of 130%/50%, and is set to rebalance monthly.
High Yield - The universe of equities for this strategy includes stocks that are regarded as "High Yield" (with a dividend yield over the last 12 months greater than 3%) at attractive valuations (price-to-earnings ratio under 15), and is sorted based on equally-weighted ratings from all analysts. After sorting, the 10 highest-ranked of these stocks comprise the long portion of the portfolio, and the 10 lowest-ranked comprise the short portion. The investment amount you allot to the strategy is allocated using a long/short ratio of 130%/50%, and is set to rebalance monthly.
Overvalued - The universe of equities for this strategy includes stocks that are regarded as "Highly Valued" (with a price-to-earnings ratio greater than 10) with strong performance (a year-to-date change greater than 10%), and is sorted by market capitalization. After sorting, the 10 lowest-ranked of these stocks comprise the long portion of the portfolio, and the 10 highest-ranked comprise the short portion. The investment amount you allot to the strategy is allocated using a long/short ratio of 130%/50%, and is set to rebalance monthly.
Investment Amount and Long/Short Leverage -Specify an investment amount that will be used to calculate simulated historical performance, and then specify the percentage of that amount you want to allocate to creating long (up to 500%) and short (up to 300%) positions. Select Filter by Industry to display the Industry Filter. Specify industries to include in your hypothetical portfolio, and set limits on how much of each industry to include as long and/or short positions. Optionally define restrictions on all or specific stocks.
Universe - Define the universe of equities for the strategy to invest in by filtering by index and last price. Use the Add Additional Filters drop down list to choose from a myriad of other filter criteria including High/Low/Volume/History, Dividends, Fundamentals and Short Selling. Set a Minimum/Maximum range for all filters, and view the filter and min/max range graphically in the filter's histogram chart.
Investment Strategy - Sort the stocks in your investment universe by Market Capitalization, Analyst Ratings by top research providers, and more than 40 Other Criteria, four of which we select for you to get you started. Specify how the strategy should determine the long and short positions to include (i.e. go long in the top 10 ranked equities and short in the bottom 10), how positions should be sized and when to send a rebalance notification.
Backtest Settings - Set the time period over which back testing results are displayed and the index against which performance is charted. Elect to optimize the weight of positions based on highest return, lowest variance or highest Sharpe ratio, and the weight of ranking providers.
See results displayed directly in the left pane of the Portfolio Builder tool as you make your selections and set your filters in the sidecar. Once you're satisfied with your investment rules and backtesting results, click the Invest button to create orders and invest in your custom portfolio. Once you've invested, the purple "H" badge changes to a green "I" badge.

Once you have funded a strategy, your TWS Portfolio displays positions with a "+" sign in front. Click to expand the position and see separate entries for the asset as a position in a strategy and the asset as an "independent" position, or not part of a strategy.
Find out more at our Portfolio Builder Feature in Focus page.
NOTE: Currently Portfolio Builder is only available to individual investors.
You can now watch live, streaming Bloomberg TV directly in the News panel of TWS when you add it as a news feed. This feature is free to both paper and live trading accounts. Use the slider at the bottom of the window to switch from video to audio-only, and pause the live feed at any time using the controls at the bottom left of the window. Expand the viewing screen by double-clicking the title bar of the window, or clicking the full screen icon in the bottom right corner.
To create a Bloomberg TV news feed, from the News panel in the Mosaic click the New Tab arrows and select Bloomberg TV from the list of feeds. Please note that while this feature is in beta, the daily allotment of viewing time may be limited.
Clients who have a paper account in addition to their IB trading account have always been required to use a different set of login credentials for each of these accounts. Effective with 955 beta, this is no longer the case. You can now log into either your paper or live (production) account using your production login credentials. Use the new Trading Mode drop-down on the Login box to select the account type. Settings will be saved separately just as they are now, so you can make changes to your paper account and be sure they will only be saved to the paper account settings.
You can still log into your paper account with your paper account credentials.
A new checkbox in the Mutual Fund/ETF Replicator, "Consider Liquidity During Search," allows you to specify whether or not to also include "greater liquidity" as a search parameter when the tool looks for comparable ETFs with low management fees.
The TWS Sound Manager now provides voice notifications, in addition to the default beeps and bells. The voice profile gives you more specific notifications details; instead of hearing a beep that indicates an order has filled, you will hear "Order Filled." We currently support "British (Male)" voice, and will be adding more voice selections in upcoming releases.
To enable voice notifications, open Global Configuration from the Mosaic File menu, and select Sound Manager from the list in the left pane. Choose the selection from the new "Profiles" drop down list, and use the checkboxes next to each event to enable or disable a notification for that event. To apply different event notification types per event, use the "Down" arrow next to an event, and specify how many times to replay a notification in the "Repeat Count" field.
A new market data column, "52 Week Fraction" has been added to the "Fundamentals" category. This field shows the (Last Price 52 week low)/(52 week high 52 week low). The closer the percentage is to 100%, the closer the current price is to the 52 week high.
To add columns, hold your mouse over an existing market data field name until the "Insert Column" command appears. Click the command and scroll to the appropriate category and click to display available fields. Select a field to add it to the left of the current column.
Use this tool alone or in conjunction with the Implied Volatility Viewer. The new Option IV Term Structure shows the Last Trading Day along the bottom horizontal axis and the at-the-money IV for that date along the vertical left axis. Use checkboxes at the top to view Today and/or Yesterday's previous close data. Change the color scheme and the display and configuration of the horizontal axis using the "Configure" wrench icon in the top right corner. Elect to show "uniform spacing" for last trading day, or to show Days to Last Trading Day. Use the slider along the bottom frame to zoom, and use the right-click menu to show data tooltips.
To open the tool, from the New Window drop down select Option Analysis then Interactive Analytics and then select Option IV Term Structure.
Additionally, the Futures Term Structure has been updated to allow changes to color scheme and the display and configuration of the horizontal axis using the "Configure" wrench icon in the top right corner. Elect to show "uniform spacing" for last trading day, or to show Days to Last Trading Day. Use the slider along the bottom frame to zoom, and use the right-click menu to show data tooltips. Open the Futures Term Structure from the New Window dropdown by selecting More Advanced Tools and then Futures Term Structure.
The IB Traders' Insight, designed to give traders an edge with daily global market commentary written by traders and industry contributors, is now available as a separate news feed in TWS. Access the Traders' Insight from the Daily Lineup, and as a selection from the "News" drop down list found at the top of the Mosaic interface and from the IB Research Platforms toolbar in classic view.
Visit our web site to sign up to receive the IB Traders' Insight roundup in email or as a text alert, and to find out more about the IB Traders' Insight.
The following enhancements were added to the Risk Navigator:
- The ability to change font size: By default, the Risk Navigator inherits the font from TWS, but you can change the font size just within Risk Navigator by clicking the Configuration "wrench" icon from the title bar and selecting Configure Font. At the bottom of the Volatility and Analytics configuration page, set the custom font size.
- Handling of expired positions: When you open a saved "what-if" portfolio that includes expired positions, you can elect to have Risk Navigator transform these positions based on the settlement procedure. For example, an expired at-the-money IBM option position would be replaced by the proper amount of IBM stock and cash. If an expired position exists in your actual portfolio, you can elect to have Risk Navigator create a new "what-if" portfolio populated with your existing positions and it will transform expired positions as noted in the new "what-if."
- Change Display Type on P&L Plot's Underlying Price Axis: In the P&L plot, if you select a single underlying you can toggle between displaying the absolute underlying price and the underlying price change as a percentage by clicking the label along the horizontal axis and selecting a different display type.
To open the Risk Navigator, from the New Window drop down select Risk Navigator from the Advanced Trading Tools section.
The best-efforts VWAP algo now includes a checkbox to "Speed up when market approaches limit price." When checked, this feature will increase the rate of trading when the order is marketable and the market prices closes the gap toward the order's limit price since the chance of a market move resulting in the order becoming non-marketable is high. Check this feature to help ensure a better fill rate for relatively small order sizes.
To use an IBALGO, from the Destination field for an order select IBALGO. For orders created in the Mosaic Order Entry panel, access the Destination field using the "advanced" panel.
Triggered alerts that you define in TWS for Mobile using the Trading Assistant feature are now shown in TWS in the form of IB FYIs. You can check the FYIs at any time by clicking "FYI" in the Mosaic Anchor panel. Additionally, the Dividend Advisory FYIs previously available only from the Option Expiration tool will now also display in the FYI sidecar.
The new Cloud Scanner feature makes any scanners you create or update in TWS available for viewing in TWS for Mobile. Scanners are saved to the cloud when you exit TWS, or when you choose to File> Save Settings, and will be downloaded and viewable within the Scanners page of TWS for Mobile.
To disable this feature, deselect the "Save market scanners to cloud" feature on the Lock & Exit page of Global Configuration.
Real-time charts now provide two more bar types, Hollow Candles and Heiken-Ashi, in addition to the current High Low Bar and Candlestick.
- The Hollow Candles display green unfilled candlesticks when that period's close is higher than its open.
- The Heikin-Ashi candles use the open-close data fro the prior period with the open/high/low/close data from the current period to create a combo candlestick.
To specify a bar type, from within a chart select the Edit menu and choose Chart Parameters. In the Time Period field ensure that a Candle Size is selected. In the Bar Type field use the drop down selector to choose a bar type.
A new ibalgo, "Adaptive" has been added to our growing suite of algos. This algo is designed to ensure that market and aggressive limit orders trade between the spread. You can specify how urgently you want the order to fill using the "priority/urgency" selector in the algo window.
To use an Adaptive IBALGO in Mosaic, create a buy or sell order and use the LMT order type field to select IBALGO and then select Adaptive. Enter or modify a limit price to use a limit order, or select MARKET from the price field to use a market order. Specify the urgency using the algo parameters from the Advanced panel, and click Submit to send the order.
IBALGOs, including Arrival Price, Close Price, VWAP, the new Adaptive algo and more, are now easily accessible from the Order Type field under the IBALGO category, both from within Mosaic Order Entry and from the Classic TWS order line. Previously IBALGO had to be selected as a routing destination which requires extra steps in Mosaic as the Destination field resides in the Advanced panel.
Additionally, you can tag any algo as a "Favorite," which will add the algo to the drop down list of order types, allowing you to select the algo directly the next time you create an order, rather than opening the IBALGO category and scrolling to the selection. To tag an algo as a favorite, click the "star" icon on the order type when you first select it.
To use an IBALGO, from the order type field select IBALGO and then choose the algo from the secondary list. You can also continue to select IBALGO as a routing destination and set up the algo from there.
- In the Portfolio page, when the "Total" row is displayed and the P&L column is configured to "Show Percentage in Total Row," the percent value (shown next to the absolute value) was being erroneously calculated as a percentage of the "Previous Day's Equity with Loan Value." This has been fixed to be calculated as a percentage of the "Net Liquidation Value."
- For complex (combination) positions, the market price field now uses the midpoint instead of the Last even if native last price is available from exchange.
- Advisors: For advisors, the account selector no longer provides the ability to choose a strategy under an account for individual viewing. Instead, breakdown by strategies appears as a separate selection on the Account Window and is integrated into the portfolio window as part of the default display.
- Sometimes, complex (combination) positions displayed incorrectly in two rows on the Summary page of the Classic TWS Trade Log, with the second row showing as empty. This has been fixed.
2015
Build 954 - October 2015
Stay informed of marketplace events that could affect your investments with FYI realtime notifications sent to you ahead of takeovers, earnings, options expirations and more. IB FYI notifications are now configurable from within TWS. To view IB FYIs, click the "FYI" button within Mosaic. To configure settings and delivery options, click the configuration wrench icon and use the FYI Subscription Settings tab to turn notifications on and off. Use the FYI Delivery Options tab to specify how to receive notifications.
To find out more, see the FYI Feature in Focus page. To modify settings for the Dividends and Economic Event Order Suspension automatic actions, log into Account Management and use the Manage Account > Trade Configuration > IB FYI page.
The Mutual Fund Replicator tool, used to find ETFs that are comparable to a user-entered Mutual Fund, now allows you to enter an ETF and will search and return the top comparable ETFs. See the Highest Correlated ETF, Performance Analysis, and a Return Comparison between the entered ETF and comparable ETF(s).
To open the Mutual Fund/ETF Replicator from Mosaic, use the New Window drop down and look in the Technical Analytics section. From Classic TWS view, use the Analytical Tools menu.
See the TWS Users' Guide for instructions on using the replicator.
The Close Position action, which allows you to close all or a percentage of all or selected positions, has been redesigned to be more powerful and precise. You can now choose to close all positions, or just all long or all short positions, and filter by asset type. For example, you could elect to close 30% of selected long options positions or 75% of all of your short stock positions.
- When you close ALL positions, the specified orders are transmitted immediately once you click "OK."
- When you close a portion of selected orders, the orders are staged in the Orders panel and you must manually transmit them.
- When you select a single position, the order is staged in the Order Entry panel and you must manually transmit.
Additionally, for positions in a model or strategy, you can only elect to close 100%. Only positions in the "Independent" group, which means that they aren't part of any model or strategy, can be partially closed.
To use the Close Positions feature, select one or more positions and use the right-click menu to choose Trade and then your close positions selection. Elect to close a percentage of the selected position(s), or to specify and close a percentage of all positions. Define your filters and criteria in the dialog box and click OK to stage or submit closing orders.
A new column, Futures Open Interest, can now be added to TWS windows and displays the current quantity of that future's unsettled contracts. Additionally, you can now see Open Interest for derivatives in the Quote Details window. To enable this feature, click the Wrench icon in the Quote Details title bar and select Settings. In the Layout section of the Quote Details page ensure the "Implied Volatility, Open Interest" checkbox is checked. Also, ensure that the "Futures Open Interest" column has been added to your watchlist.
Once enabled and when data is available, the new Open Interest in Quote Details will display:
To maximize the Quote Details window and see all data without a scroll bar, double-click the title bar of the window. Double-click again to send the window back to its original space and size. Note that this expand feature can also be useful when looking at charts.
Single options contracts in which you do not hold a position now include a new "Strategy" button and menu selection "Build Complex Position" that are accessible from the right-click menu from the contract line to help you easily build a complex position using the existing options contract or contracts as the starting legs.
To use, select one or multiple options contracts and use the right-click menu to select the Strategy button (for a single selection) or the menu command "Build Complex Position" (for multiple selections). Note that the option(s) appear in the Strategy Builder to start the complex position, and the option chain allows you to select the rest of the legs. Click the bid or ask price for a put or call to add that leg, and when complete define order parameters and submit the order.
NOTE: If you see the "Roll" button and not the "Strategy" button, this means you have a position in the option.
Three new short-term volume history fields and three new market scanner parameters have been added. Add new fields to any TWS window by holding your cursor over a current field and then selecting Insert Column. New fields are in the High/Low/Volume/History category and show the short term volume on a contract. Interpolation may be applied if necessary
- Short-Term Volume 10 Min - Shows the volume over the past 10 minutes.
- Short-Term Volume 5 Min - Shows the volume over the past 5 minutes.
- Short-Term Volume 3 Min - Shows the volume over the past 3 minutes.
In the market scanners, select High 3min Volume, High 5min Volume and High 10min Volume on stocks, futures, and SSFs to return the contracts with the highest volume in these categories. In the Mosaic Market Scanner, find these new fields in the Fields and Filters section by clicking Add field. In the Advanced Market Scanner accessible only in Classic TWS, find these in the Parameter section.
Find the Issuer Country for stocks in IB TWS. Right-click a stock and select Contract Details> Description to see the "Issuer Country" field. Hold your mouse over the "i" above the abbreviation to see the full name of the country. Also find this information as a filter in the market scanners, and as a field in the Contract Description category that can be added to any TWS window.
The right-click menu within the P&L Plot has been reworked to enhance usability. The items have been renamed, reordered and categorized within the menu. In addition one new item, Coordinated Price & Volatility curves, has been added. The Implied Volatility Viewer now allows you to import previously exported curves using the Import menu command from the right-click menu. To open the Implied Volatility Viewer, use the New Window dropdown and select Option Analysis>Interactive Analytics>Implied Volatility Viewer.
A new precautionary setting, Size Modification Limit, has been added to Global Configuration. This feature is designed to help ensure you don't accidently change the order size when you are modifying an unfilled order by greater than the defined percentage, or 500% which is the default. To modify the Size Modification Limit, from Global Configuration select Presets from the left pane and then select an asset type. Scroll down to the Precautionary Settings section at the very bottom of the Presets page and enter a new percentage in the Size Modification Limit field.
Hedge Funds, Brokers and Financial Advisors with clients who elect not to use IB for clearing can now submit orders for away clearing using the Mosaic Order Entry panel. Previously this was not accessible for accounts that cleared away.
The assigned default API ports for production and paper accounts are now different to allow both accounts to run at the same time. Production port is still 7496 and paper port is now 7497. These ports are automatically assigned when TWS is installed or reinstalled. Likewise, IB Gateway users will see the change of default ports for paper go from 4001 to 4002, leaving 4001 for the production version.
To manually change the port in TWS, from Global Configuration select API and open the Settings page. In the Socket Port field modify the port number.
The chart in the ETF/Mutual Fund Replicator now identifies the distribution type for Mutual Fund payouts as either Dividend Income or Capital Gains. The tax implications for these different types of distributions may differ.
The Time & Sales window now displays historical data for US stocks and warrants in shares instead of in lots, for example "2500" instead of "25x100." Real-time data still displays in lots. This data change applies to the Time & Sales window only, and does not require any configuration. Data for all products other than US stock and warrants was previously, and still is, displayed in shares.
In addition to viewing FX quotes in the more precise 1/10 percentage in point (pip) format (versus the usual 1/2 pip display), you can now also trade FX quotes with this same precision.
To enable, from Global Configuration select Display > Ticker Row and scroll to the bottom of the window to select "Allow Forex trading in 1/10 pips."
A new time in force for US stocks has been added that will allow the stock order to be tagged as "Preopen Only." When selected, the order will fill during the pre-open session, or be cancelled.
For orders that use a trigger and are enabled to work over multiple days, a new checkbox, Trigger Once, allows you to tag the order to remain triggered until filled or cancelled. Leave the box unchecked to deactivate unfilled orders at the end of the day and allow them to trigger the following day if/when trigger conditions are met. This field is found in the Order Presets, and on the Basic tab of the order ticket.
Build 953 - September 2015
We are pleased to announce the new TWS Desktop Launcher, which provides a faster, more convenient and more secure method for logging into TWS. Our comprehensive launch package includes everything required to log into and run TWS, eliminating the need to update additional runtime software as new versions are released.
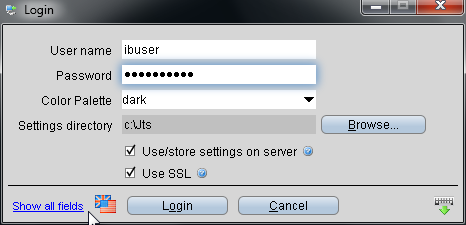
The launcher is automatically installed in the form of a desktop icon when you log into the beta or Latest versions of TWS from the Login menu on the IB web site. Once the icon is installed, simply double-click to log into TWS. To change between Latest and Beta versions, from within the login window click "Show all fields" and use the Version drop down box to choose the TWS channel. Click the "Apply & Restart" button at the bottom of the dialog box, and then enter your username and password to complete the login process.
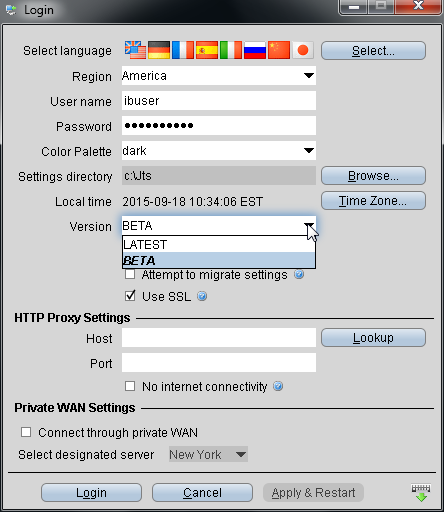
The Mosaic Order Entry panel has been redesigned to significantly speed up the price entry process by providing one-click Bid, Mid and Ask price entry. Additionally, the price wand, an incremental price ladder with one-click entry, will display when you click the Bid, Mid or Ask price. This feature allows you to rapidly enter an order price with a single click. The Position field is also clickable and can be used to quickly enter the order quantity.
To use these features, set to Order Entry panel to "Interactive Mode." Click the wrench icon and then selecting "Settings" and pick the Interactive radio button.
Our Stock/ETF Benchmarker tool lets you benchmark your portfolio against a user-selected benchmark index for the current day, and shows you the contribution and weighting of individual equity positions. Open the tool from the New Window dropdown.
For more information on using the tool, see the Stock/ETF Benchmarker highlight. Note that this tool is not yet available to all IB clients.
The Option Selector, used to choose options contracts to add to a trading page or watch list, has been significantly improved with the following enhancements:
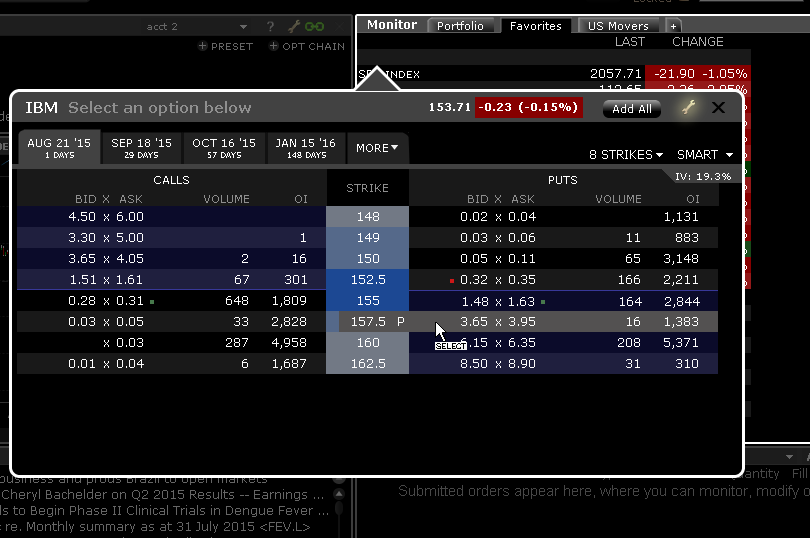
- The first four months of options contracts are grouped by tab that includes the last trading day plus the number of days to the last trading day.
- Options are shaded to indicate that they are in-the-money.
- When you hold your mouse over a call option (on the left side of the strike price column) the row is highlighted and displays a "C" to the left of the strike. For puts, a "P" is displayed to the right of the strike.
- Strikes can be colored using a Grayscale, Blue or Fall color scheme. Change the color scheme by clicking the wrench icon in the upper right corner of the window.
Positions in your portfolio can be grouped by security type, expiry, sector, industry and underlying. We have now added the ability to group positions by recent trade date. When using this sort, your positions will be grouped under the trade date for all trades within the last seven days. For positions resulting from a fill across multiple days, TWS will use most recent day for the entire position. Positions resulting from trades further back than seven business days will be grouped under an "Older" section.
To modify the position grouping in the Portfolio window, click the contract column heading and select from the "Group By" list.
A new field has been added to the Contract Description category: Days To Last Trading Day. This field displays the number of days available until the contract's last available trading day, and can be added to any tool or window that allows addition or removal of fields.
Build 952 - August 2015
The Implied Volatility Viewer, introduced in release 951, has been enhanced to include:
- The ability to edit the Interest Rate and Dividend Schedule, and to compose a basket of contracts. Make these selections from the Edit menu when the tool is in "Local PC" mode. To toggle modes use the right-click menu from within the chart. In "Local PC" mode, the model Implied Volatility is calculated based on the loaded option chains in TWS. In "Remote Server" mode, the model Implied Volatility is calculated based on the entire volatility surface for the selected underlying including all options in the related option chain that have a valid quote.
- Export Tool - When the tool is in "Remote Server" mode, the export command creates two .csv files: one of the observed data and one of the fitted model curve parameters
To open the Implied Volatility Viewer, from the New Window drop down select Options Analysis and then Interactive Analytics, then select Implied Volatility Viewer.
Enhancements to IB Risk Navigator reports include:
- The ability to add new Long and Short P&L columns via the Metrics menu. Select Metrics, then Value Columns then Long/Short. Choose to add:
- Long and Short Value,
- Long and Short Value % NLV
- Long and Short Unrealized P&L (both as a value and as a percentage)
- Long and Short Realized P&L
- Long and Short Total P&L
- Long and Short P&L for the day
- A new "Long/Short" position sorter that will group positions in your reports into Long and Short sections. From the Dimensions menu, select "Long/Short." The report will add a new "Positions" column and have Long and Short dividers.
- Assign a country to a contract - Use the right-click menu from any contract in the "Risk by Country" report and select Change Country to assign any country to the selected contract. This assignment is used for grouping purposes in the Equity's Risk by Country report.
The Contract Description now includes additional bond ratings in addition to Moody ratings. Bond rating subscribers will see all available ratings laid out in a row separated by a slash (/) in the Contract Description field and if the field is added, in the Bond Rating field. Hold your mouse over the description to see a list of rating provider: rating, for example MOODY: AA3, FITCH: A+. The Fitch and S&P ratings are also now included along with Moody as filters in the US Corporate and US Municipal Bonds scanners.
To see all bond ratings, you must subscribe to "Bond Ratings" in the fixed income area of the North America Market Data page. Log into Account Management and select Manage Account>Trade Configuration>Market Data. This single subscription includes all available bond ratings.
A new comprehensive chart study, Correlation Coefficient, has been added to our charts. The Correlation Coefficient (PPMCC) measures the linear correlation or dependence between two variables, in this case between two securities, in an attempt to show how closely the securities are related to each other. The value is positive when both securities move in the same direction (either up or down) and negative when they move in opposite directions.
To use the Correlation Coefficient, from within a chart click Edit>Studies and in the Comprehensive Studies section select the indicator.
Build 951 - July 2015
For all stock, index and futures that have option contracts, use the Implied Volatility Viewer to see option volatility plotted against a range of user-specified strike prices for a user-defined expiry list. Frequently used settings can be adjusted using the right-click menu within the chart. Change display settings, expiries and strikes, and open such tools as the Crosshair and tooltip display. Use the wrench configuration icon to define other settings. To zoom in, use scrollbars or draw a rectangle on the chart to zoom to that area. To open the IV Viewer, start from the New Window drop-down in Mosaic, and the Analytical Tools menu in Classic TWS. Select Option Analysis then Interactive Analytics and then Implied Volatility Viewer.
You can now define IBALGO as a preset for all security types that support them, including: futures, forex, CFDs, and warrants along with stock and options. Access Global Configuration from Mosaic using the File menu, and from Classic TWS using the Edit menu. In the left pane expand the Presets selection and choose a security type. Scroll to the bottom of the Presets settings in the right pane and in the Algorithm section select the algo destination from the drop down list. Available algos will display in the Algorithm drop down list once the algo destination is chosen.
Once account aliases are defined in account management, there was previously no way within TWS to identify which account number was paired with which account alias. Now, the user can hold their mouse over the account alias within TWS and see the actual account number in the mouse-over help. Additionally, in the Advisor >Account Alias section of Global Configuration we now show a table with matching alias/account number pairs.
You can now elect to view Time & Sales for multiple contracts versus just a single contract. To open the Multi-Contract Time & Sales window, from the New Window drop down select Time & Sales, and then select Time & Sales (Multi Contract). Next click the Configure wrench icon to open the Select Tickers and define the tickers you want to see. Use the Import button to import a ticker list from a basket or .csv file. Symbols are sorted by time, and when the tool is in multi-contract mode the "Symbol" field is displayed. Note that the multi-contract display only supports real-time data.
Margin Cushion alerts in TWS now have the "Repeatable" feature available. This means that you can set the alert once, and anytime your margin cushion falls below your specified level the alert will sound. To create an alert, right-click any contract and select the bell icon from the quick menu. Click the Advanced Settings button from the Alerts box to set a margin cushion alert.
In addition to being able to add futures contracts quickly to TWS using just the symbol, you can now also add futures calendar spreads by entering the two symbols separated by a dash (-). For example, to enter a CL June 15/Sep 15 calendar spread, simply enter "CLM5-CLU5" or "CLM-U5."
A series of new Jefferies and CSFB algos have been added to TWS. To select an algo, from the Destination field select JEFFALGO or CSFBALGO, and then select the algo.
Jefferies Algos:
- Blitz - A liquidity seeking algo that sweeps all displayed markets, and sends Immediate-or-Cancel orders to all non-displayed markets.
- Buyback - This strategy provides volume-participation trading to issuers seeking safe harbor (SEC Rule 10b-18) in stock repurchases.
- DarkSeek - A liquidity seeking algo that searches only dark pools.
- Finale - Benchmark algo that lets you trade into the close.
- Multi Scale - Three-tiered "holder" strategy - use algorithms within this work flow.
- Opener - Benchmark algo that lets you trade into the open.
- Pairs - Net Return - Lets you execute two stock orders simultaneously. Use Net Returns to unwind a deal.
- Pairs - Ratio - Execute two stock orders simultaneously - use the Ratio algo to set up the pairs order.
- Pairs - Risk Arb - Lets you execute two stock orders simultaneously. Allows you to setup, unwind or reverse a deal.
- Patience - Liquidity seeking algo targeted at illiquid securities.
- Portfolio - Execute a group of stock orders according to user-defined input plus trading style.
- Post - Allows trading on the passive side of a spread.
- Seek - This strategy pursues best execution for illiquid securities by seeking out hidden liquidity from multiple sources, including hidden and displayed market centers.
- Strike - This strategy seeks best execution in the user-designated time period, while minimizing market impact and volatility cost and tracking the arrival price.
- Trader - Change order parameters without cancelling and recreating the order. Workflow algo that lets you interactive with a working order and toggle between strategies with a single click.
- TWAP - This strategy spreads transactions evenly over the designated time period by slicing the total order quantity into smaller orders.
- Volume Participation - This strategy allows the user to designate the percentage of stock to be executed during a specified period of time to keep in line with the printed volume. The impact of the trade is directly linked to the volume target you specify.
- VWAP - This strategy automatically manages transactions to achieve the all-day or intra-day VWAP through a proprietary algorithm.
CSFB Algos:
- Auction - Allows you to call an auction and control your order.
- Blast - An aggressive algo that simultaneously routes your order to all available exchanges and ECNs with an intermarket sweep designed to getting as close to simultaneous arrival as possible.
- Close - Minimizes market impact by intelligently working orders into the close.
- Crossfinder+ - This strategy locates liquidity among a broad list of independent and broker-owned dark pools, with continuous crossing capabilities. Using dynamic smart routing logic, CrossFinder+ will spread your order over multiple destinations. This algo will fill at the midpoint or better, and may not execute.
- Float - This tactic displays only the size you want shown and floats on the bid, midpoint, or offer until completion. Enter a display size in the Iceberg field and choose a patient, normal, or aggressive execution.
- Float Guerrilla - Uses the Guerrilla algo but floats a small, visible portion near touch to facilitate trading when that side of the book becomes active.
- Guerrilla - The GUERRILLA algo works differently depending on the Execution Style you select:
- Normal and Passive modes: This tactic works orders without displaying bids or offers. When liquidity materializes, it seeks to aggressively participate in the flow. If liquidity is poor, the order may not complete.
- Aggressive mode: This will hit bids/take offers in an intelligent way based on a fair price model. It minimizes market impact and never posts bids or offers.
- Inline - Minimizes implementation shortfall against the arrival price. Participation increases when the price is favorable.
- I Would - This tactic is aggressive at or better than the arrival price, but if the stock moves away it works the order less aggressively. However, if the stock moves in your favor, it will act like Sniper and quickly get the order done.
- Lightpool - Routes orders to the Credit Suisse ECN.
- Pathfinder - PathFinder will intelligently and dynamically post across multiple destinations, sweeping all available liquidity. The remainder will be posted at your limit price.
- Pre/Post - Smart routed algo to be used during pre- and post-market hours. Only supports limit orders.
- Reserve - Use the Iceberg field to display the size you want shown at your price instruction. If you do not set a display size, the algo will optimize a display size. Upon getting filled, it sends out the next piece until completion.
- Sniper - This is a very aggressive tactic that will hit bids/take offers that are better than your limit price, but will never post bids or offers. It achieves high participation rates. Note it is not a pure sweep and can sniff out hidden liquidity. As a result, it is often a better choice than placing a limit order directly into the market.
- Tex - Designed to minimize implementation shortfall. The tactic takes into account movements in the total market and in correlated stocks when making pace and price decisions. Timing is based on price and liquidity.
- TWAP - The system trades based on the clock, i.e., on a 2-hour order the system is 25% done after 30 minutes, 50% done after an hour, etc. Unlike VWAP, TWAP (time weighted average price) does not speed up/slow down based on projected volume or price moves. However, it does use smart limit order placement strategies throughout the order.
- Volume Inline - Works the order in line with the volume.
- VWAP - The system attempts to match the VWAP (volume weighted average price) from the start time to the end time. A unique and powerful feature is the ability to accept a maximum percent volume limit (“don’t be more than 20% of the volume.”) The system trades over your time period, subject to your price and volume constraints.
Our Advanced Market Scanners, accessible from the New Window drop down, now includes a US Municipal Bonds scanner to find bonds by state (or for all states). Filter returned muni bonds by quantity, price and yield, payment frequency rating, maturity date, coupon rate and more.
For more information creating Advanced Market Scanners, see the TWS Users' Guide.
You can now reallocate funds in model portfolios by an absolute target amount as well as by a target percentage. To reallocate, select the account whose investments you want to reallocate, and right-click the "Models" heading. Select Reallocate and enter an absolute amount in the Target Amount field for the model you want to reallocate.
The below items have been fixed or modified:
- Daily P&L is now available for complex multi-leg positions.
- The Order Preview window now clearly shows whether the client will be paying (debit) or receiving (credit) funds.
- Partial Fills in BasketTrader: Previously the fill update status for partial order fills was not accurately reflected in the BasketTrader. This has been fixed.
Build 950 - May 2015
We have recently added a new set of Portfolio Analysis fields that can be added to the P&L tab of the IB Risk Navigator. Fields include Mark-to-Market, Realized P&L and Unrealized P&L. To add fields, from the Risk Navigator Report menu select Designer. In the left pane, ensure that P&L>P&L Summary is selected. In the right pane from the Available Columns list, open the Portfolio Analysis category and double-click a field to add it to the P&L Summary.
Available new fields include:
- Mark-to-Market P&L Month-to-Date - Shows the profit or loss recognized in the current month for both open and closed positions.
- Mark-to-Market P&L Month-to-Date (%) - The percent that the position's mark-to-market P&L for the current month-to-date accounts for, relative to the portfolio's total.
- Mark-to-Market P&L Year-to-Date - Shows the profit or loss recognized in the current year for both open and closed positions.
- Mark-to-Market P&L Year-to-Date (%) - The percent that the position's mark-to-market P&L for the current year-to-date accounts for, relative to the portfolio's total.
- Realized P&L Month-to-Date - Realized month-to-date P&L from the previous business day + realized P&L from the current day.
- Realized P&L Month-to-Date (%) - The percentage of the position's realized P&L month-to-date to the portfolio's total month-to-date P&L.
- Realized P&L Year-to-Date - Realized year-to-date P&L from the previous business day + realized P&L from the current day.
- Realized P&L Year-to-Date (%) - The percentage of the position's realized P&L year-to-date to the portfolio's total year-to-date P&L.
- Unrealized P&L Month-to-Date - The change in unrealized P&L in the current month.
- Unrealized P&L Month-to-Date (%) - The percentage of the change of the position's unrealized month-to-date P&L to the portfolio's total change in unrealized month-to-date P&L.
- Unrealized P&L Year-to-Date - The change in unrealized P&L in the current year.
- Unrealized P&L Year-to-Date (%) - The percentage of the change of the position's unrealized year-to-date P&L to the portfolio's total change in unrealized year-to-date P&L.
Within TWS and Mosaic, we use the last trading day and not the actual expiration date for futures, options and futures options contracts. To be more accurate, all fields and selectors throughout TWS that were labeled Expiry or Expiration have been changed to Last Trading Day. Note that the last trading day and the expiration date may be the same or different dates.
In many places, such as the OptionTrader, Probability Lab and other options/futures tools, this is a simple case of changing the name of a field to Last Trading Day. In other cases the change is wider-reaching. For example, basket files that include derivatives were previously saved using the Expiry header. When you try to import these legacy .csv files, you will now receive a message requiring that you change this column title to LastTradingDayorContractMonth before the import will be accepted. New basket files that include derivatives will use this correct header. Additionally, this new field serves two functions. If you use the format YYYYMMDD, we understand you are identifying the last trading day for a contract. If you use the format YYYYMM, we understand you are identifying the contract month.
In places where these terms are used to indicate a concept, we have left them as Expiry or Expiration. For example in the Option Chain settings where we allow you to "Load the nearest N expiries" we have left the word expiries. Additionally, the Contract Description window will show both the Last Trading Date and the Expiration Date. Also in cases where it's appropriate, we have replaced Expiry or Expiration with Contract Month.
We continue to add indicators to our interactive charts. So far this release includes:
- Fisher Transform - Used to predict price reversals. The Fisher Transform helps to more clearly identify extreme price movements by transforming the probability density function of any waveform to a bell-curve.
- SMI Ergodic Oscillator - The Ergodic Oscillator (EO) is a double- smoothed True Strength Index (TSI) with a signal line. It acts like a stochastic indicator without the compression often seen with stochastics at extremes. As a result, the Ergodic helps to register long trends in prices.
- Net Volume - A security's uptick volume minus its downtick volume over a specified time period. The net volume of a stock aggregates the total positive and negative movements of the security over this period. When the total upward movement is greater than the total downward movement over this period, the stock has a positive net volume.
- Volume Rate of Change - The volume rate of change indicator is used to gauge the volatility in a security's volume. The volume rate of change is a powerful indicator when estimating a security"s ability to push through key resistance. It is calculated the exact same way as the rate of change indicator except instead of tracking the closing price it tracks volume. The calculation is: Volume ROC = ((Volume) Volume n-periods ago )/ Volume n-periods ago) *100.
- Balance of Power - The Balance of Power indicator measures the market strength of buyers against sellers by assessing the ability of each side to drive prices to an extreme level. The calculation is: Balance of Power = (Close price Open price) / (High price Low price) The resulting value can be smoothed by a moving average.
Traders may use this indicator to help:
- Identify the direction of a trend.
- Find divergences between the price and the BoP in order to identify a potential trend reversal or trend continuation setup.
- Take advantage of overbought and oversold conditions.
- Relative Momentum Index - The Relative Momentum Index (RMI) is a variation of the Relative Strength Index (RSI). While the RMI counts up and down days from today's close relative to the close n-days ago (n is not limited to 1), the RSI counts days up and down from close to close.
We have added seven new NAV columns in a new "ETF" section of Layout Configuration. To add columns, hold your mouse over an existing column until the "Insert Column" command displays. Click and expand the ETFs section to show new columns. To add multiple columns all at once, click the Configure wrench icon to and open the layout page. Select all desired columns from the Available Columns section and add them to the Shown Columns section.
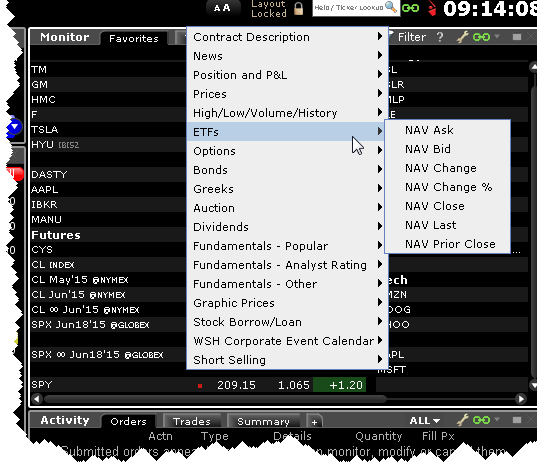
New columns include:
- NAV Ask - The ask price of the ETFs Net Asset Value, calculated based on the prices of the ETFs underlying securities.
- NAV Bid - The bid price of the ETFs Net Asset Value, calculated based on the prices of the ETFs underlying securities.
- NAV Change - The difference between the last price and the previous day's closing price f the ETFs Net Asset Value, calculated based on the prices of the ETFs underlying securities.
- NAV Change % - The difference between the last price and the previous day's closing price f the ETFs Net Asset Value shown as a percentage, calculated based on the prices of the ETFs underlying securities.
- NAV Close - Today's closing price of the ETFs Net Asset Value, calculated based on the prices of the ETFs underlying securities.
- NAV Last - The last price of the ETFs Net Asset Value, calculated based on the prices of the ETFs underlying securities.
- NAV Prior Close - Yesterday's closing price of the ETFs Net Asset Value, calculated based on the prices of the ETFs underlying securities.
We have added four new Pegged to Volatility orders for options. Instead of pegging the order price to a price, it pegs to the implied volatility.
Pegged to Primary (PEGPRIMVOL) - The pegged-to primary volatility order pegs the starting price for the order to the same side price.
Buy orders:
- Call - Peg to implied volatility BID
- Put - Peg to implied volatility BID
Sell orders:
- Call - Peg to implied volatility ASK
- Put - Peg to implied volatility ASK
Offset: Positive or no offset allowed.
Offset Action: Positive offset makes the order more aggressive. For a buy order the offset will be added to the bid and for a sell the offset will be subtracted from the ask.
Pegged to Midpoint (PEGMIDVOL) - The pegged-to-midpoint volatility order pegs the starting price for the order to the midpoint of the bid/ask implied vol for both buy and sell orders.
Buy orders:
- Call - Peg to midpoint of bid and ask implied volatilities (Imp. Vol for bid + Imp Vol. for Ask/2)
- Put - Peg to midpoint of bid and ask implied volatilities (Imp. Vol for bid + Imp Vol. for Ask/2)
Sell orders:
- Call - Peg to midpoint of bid and ask implied volatilities (Imp. Vol for bid + Imp Vol. for Ask/2)
- Put - Peg to midpoint of bid and ask implied volatilities (Imp. Vol for bid + Imp Vol. for Ask/2)
Offset: Positive, negative and no offset allowed.
Offset Action:
- Positive offset makes the order less aggressive. For a buy order a positive offset will be subtracted from the midpoint, and for a sell the positive offset will be added to the midpoint.
- Negative offset makes the order more aggressive. For a buy order the negative offset will be added to the midpoint and for a sell the negative offset will be subtracted from the midpoint.
Pegged to Market (PEGMKTVOL) - The pegged-to-market volatility order pegs the starting price for the order to the opposite side price.
Buy orders:
- Call - Peg to implied volatility ASK
- Put - Peg to implied volatility ASK
Sell orders:
- Call - Peg to implied volatility BID
- Put - Peg to implied volatility BID
Offset: Positive offset is required.
Offset Action: The offset makes the order less aggressive. For a buy order the offset will be subtracted from the ask. For a sell order the offset will be added to the bid.
Pegged to Surface (PEGSURFVOL) - The pegged-to-surface volatility order pegs the starting price for the order to the model implied volatility as calculated by our Model Navigator.
Buy orders:
- Call - Peg to implied volatility BID
- Put - Peg to implied volatility BID
Sell orders:
- Call - Peg to implied volatility ASK
- Put - Peg to implied volatility ASK
Offset: Positive, negative and zero offset allowed.
Offset Action:
- Positive offset makes the order less aggressive. For a buy order a positive offset will be subtracted from the bid, and for a sell the positive offset will be added to the ask.
- Negative offset makes the order more aggressive. For a buy order the negative offset will be added to the bid and for a sell the negative offset will be subtracted from the ask.
We have added four new IB Algos for US stocks. IB Algos are accessible from an order line by selecting IBALGO from the Destination field.
The first three of these IB Algos, Time-, Price-, and Size Variant Percentage of Volume Strategy, allow you to participate via volume at a user-defined rate that varies with time, remaining order size or price.
- Time Variant Percentage of Volume Strategy - This algo allows you to participate via volume at a user-defined rate that varies with time. Define the target percent rate at the start time and at the end time, and the algo calculates the participation rate over time between the two. This allows the order to be more aggressive initially and less aggressive toward the end, or vice versa.
- Size Variant Percentage of Volume Strategy - This algo allows you to participate via volume at a user-defined rate that varies over time based on the remaining size of the order. Define the target percent rate at the start time (Initial Participation Rate) and at the end time (Terminal Participation Rate), and the algo calculates the participation rate over time between the two based on the remaining order size. This allows the order to be more aggressive initially and less aggressive toward the end, or vice versa.
- Price Variant Percentage of Volume Strategy - This algo allows you to participate via volume at a user-defined rate that varies over time based on the price of the security. This algo allows you to buy more aggressively when the price is low and be more passive as the price increases, and just the opposite for sell orders. The order quantity and volume distribution over the time during which the order is active is determined using the target percent of volume you entered along with continuously updated volume forecasts calculated from TWS market data.
- Close Size - Designed to minimize slippage with respect to the close price, this algo considers the user-assigned level of market risk and target percent of volume, and the volatility of the stock to determine how long before the close and at what pace it should attempt to execute the trade. It can be most useful when the order quantity is large relative to the average close auction volume and submitting the order into the auction using an MOC or LOC order type might adversely affect the close price.
View the real-time and historical term structure of futures prices with the new Futures Term Structure window. Replacing the web-based tool, this window displays a split chart that shows the real-time and historical settlement prices of the existing futures contracts for the given underlying (top chart) and the differences between the older settlement price curves and the most recent selected curve (bottom chart).
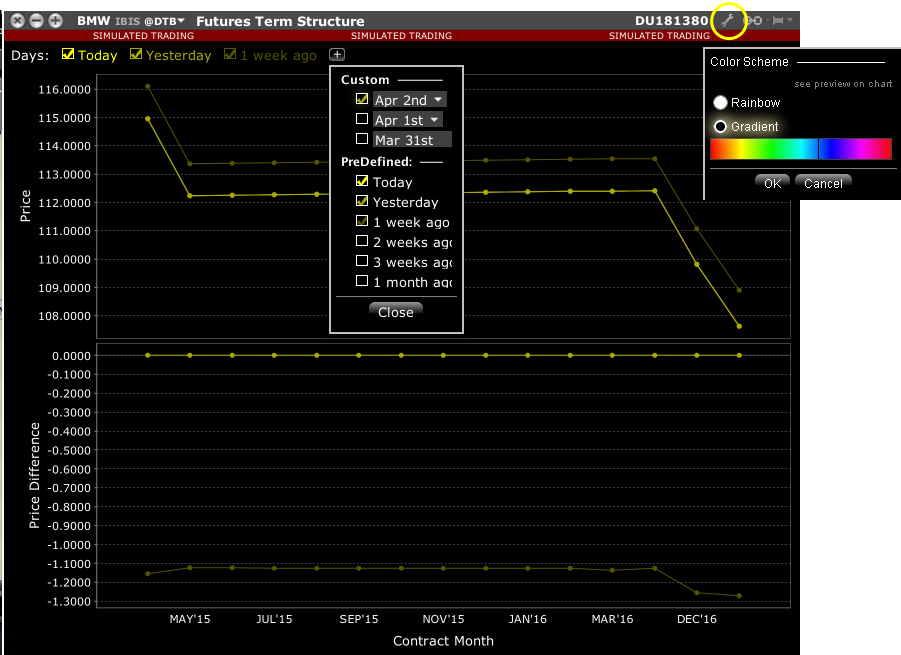
To open the tool, use the New Window drop down and select More Advanced Tools and then select Futures Term Structure. Enter the underlying in the top left entry field. Alternatively, select a futures contract and use the right-click menu to select Charts and then Term Structure.
By default yellow color gradient is used for different series. To modify the colors, click the configuration wrench icon in the top right corner of the window and select Rainbow to use different colors for each line or select a new color to use with a gradient.
The TWS Portfolio and Account Windows now display spread/combination complex positions in a single line as a unique entry, identified by the named strategy when applicable. Click the expand box next to the spread to show individual legs.
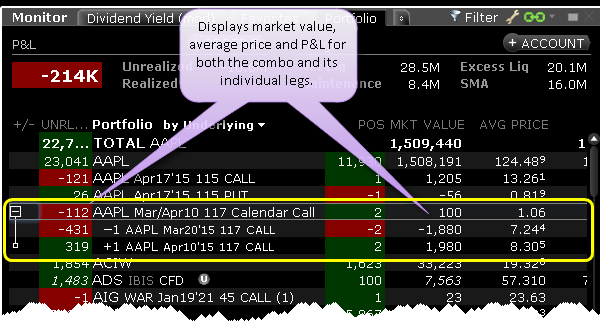
Some notes on complex position display:
- We show the net market value, average price, and realized/unrealized P&L for the position along with the value for each individual leg.
- Complex positions that share a leg on different sides will not display as the two opposite legs will cancel each other out.
- If you trade an option that effectively closes out one leg of a complex position, the complex position is dissolved and the remaining leg(s) displays as single option position.
- You can close out the entire complex multi-leg position using the right-click Trade>Close Selected Position command.
- Several tools do not reflect this Complex Position display, including Rebalance, Option Rollover and Option Exercise.
- This display is not supported in the API.
- The trade Summary tab on the Activity panel will reflect a trade that closes the position for one leg. Hold your mouse over the trade for a description of the canceled trade in which the complex position is transferred to a single option trade (or group of trades if the position comprised more than two original legs).
To turn off the complex order display (and show only individual legs), from Global Configuration select Display>Ticker Row and then select Hide complex positions. To re-enable this display, select Group legs into complex positions.
The Order Confirmation dialog box for municipal bond orders has been enhanced with the following features:
- The number of columns in the Comparable Bonds table has been reduced with the Ask, Bid and Last fields being combined with the Yield to display "size@price (yield)" for example "$100K@116.470 (2.361%)."
- Table colors are consistent - no more green highlighting.
- The Last Trade Date column shows both the last trading date and the day from today, for example "1 Month (Feb 10 '15).
- When available, rows in the table will also show deep prices, such as 2nd best bid, 3rd best bid etc.
We have recently added several new fields available throughout TWS and categorized under Fundamentals - Independent Ratings that allow you to view individual ratings issued by various research providers. Only providers to which you subscribe will be available. Additionally, these new ranking will be available in the Portfolio Builder "Rank the stocks in the Universe by..." list.
To add these columns to a page, hold your mouse over an existing market data field and select Insert Column. From the column list open Fundamentals - Independent Ratings and select the column to add.
Five new columns have been added to the TWS in the High/Low/Volume/History category. Add columns by holding your mouse over an existing market data field until the "Insert Column" feature appears. Click "Insert Column" and expand the desired category. Click to add columns.
- Close 30 days ago - Shows the closing price as of the last trading date 30 calendar days ago.
- Close 60 days ago - Shows the closing price as of the last trading date 60 calendar days ago.
- Close 91 days ago - Shows the closing price as of the last trading date 91 calendar days ago.
- Close 182 days ago - Shows the closing price as of the last trading date 182 calendar days ago.
- Close 273 days ago - Shows the closing price as of the last trading date 273 calendar days ago.
All values are adjusted for corporate actions. Once the field is included on a page, hold your mouse over a price to see the actual date of the data.
Clients who use two-factor authentication and who upgrade to the Smart phone Digital Security App (sDSA) have the option of receiving their challenge code via text when they log into TWS, and simply clicking the challenge code to have the App automatically issue the response. This feature significantly reduces time needed to log in with extra security.
To use this streamlined feature, first activate the sDSA through account management.* Once activated, when you enter your username and password into TWS (desktop version only at this point) you will receive a note indicating that an SMS message was sent to your phone. Open your phone and click the link provided in the SMS message. This opens your sDSA App on your phone. Enter the four-digit PIN you created when you activated the App, and the sDSA automatically responds to the challenge, and your login process is complete.
In cases where the SMS message cannot be received, you can use the sDSA manually the same way you previously used your security card. When you enter your username and password in TWS, open the sDSA and enter the challenge code. sDSA returns a response that you enter in the TWS response window.
*Please note that once you activate the sDSA your security card can no longer be used. Only one security device at a time can be active.
Two new columns have been added to the Time & Sales settings page. Check to display. New columns include Exchange and Condition. To view the Time & Sales, window, select it from the New Window drop down in the top left corner of the Mosaic. To access the Time & Sales settings page, from the Time & Sales title bar click the wrench icon and select Settings. Check Exchange and Condition.
In addition to grouping your Portfolio display by Security Type, Industry, Underlying, Expiry + Option Right, Expiry or None, you can now also group by Security Type + Side. To set display grouping, from the Mosaic Portfolio page in the Monitor panel right-click the Portfolio column and select the grouping.
Currently IB customers are notified of important new bulletins via a blinking red icon on the TWS interface. It's up to the customer to notice and open the bulletin. To ensure that critical trading information is not missed, we have modified this functionality to simply display the bulletin in a pop-up box on the interface.
Users with two-factor authentication now have the option to log into TWS using only their username/password credentials to view data and account information in read-only mode. To view TWS as read-only, instead of entering a challenge code, click the Read-Only Login button that displays on the challenge code window. To submit or manage orders, you will be required to complete the two-factor authentication login process.
- Read-Only Mode for API - Effective in TWS 950 and above, API users have the option to set the API to Read-Only mode. This mode allows viewing of market data and account information, but blocks any type of trading activity Additionally, users can elect to limit access only to connections made from the same computer. To set API parameters, from within Global Configuration select API.
- Native Index Prices in API - API users running TWS/IB Gateway 950 or above can now elect to show Native index prices when available. Currently the calculated index price is used by default. To change your preference in the IB Gateway, in Configuration on the API Settings page select Prefer Native Index Prices to show the exchange-native index price whenever it's available. If the API is running through TWS, the setting is defined in Global Configuration on the Display > Ticker Row page.
The following have been fixed or modified in TWS version 950:
- Issues with the "sidecar" feature resulted in users being unable to enter futures or options in the ScaleTrader Pair tab.
- The Write Options tool was not functioning as expected with the first release of beta 950.
- Some dialog boxes were incorrectly opening on top of each other preventing the user from responding to the first box which was hidden at the bottom of a group, resulting in TWS acting as if it was locked.
- When opening a 'saved' chart in a new TWS session, the Quote panel was grayed out or disabled.
- Color issue: When creating a custom ticker list for Portfolio or Watchlist News feature the added tickers could not be seen due to color issues (white text on white background).
- BookTrader:
- For BookTrader hotkey to "Buy/Sell LMT at BookTrader Price" changes to the Absolute size were not being saved and defaulting back to 100.
- The "Show size button in price ladder" gave the wrong quantity when used.
- Color issue: When switching back and forth between Account and Summary tabs, the inactive tab color is the same as the text for the label so label could not be seen.
- When renaming the Classic TWS or Mosaic workspace tabs with titles that included some special characters (<, &, "") the Settings file could not be saved.
- The tooltip text for newswires was not updating when mouse was moved to another news story.
- When trying to export Watchlist tickers, tickers from only one of multiple columns were being exported.
- The Size Wand wasn't working on mutual fund orders.
- The locked/unlocked status of the Font lock icon found in Global Configuration > Style was difficult to see with the Classic color palette.
- Conflicting enhancements resulted in the inability to create orders on the Portfolio page when the Trader Dashboard was open.
- Insufficient trading permissions or restrictions on certain symbols may result in the ability to place closing orders only.
- OptionTrader: When trying to create a futures option spread, the Strategy tab in the combo selector does note allow a Trading Class resulting in the inability to create a combination order.