Flex Queries
Instructions
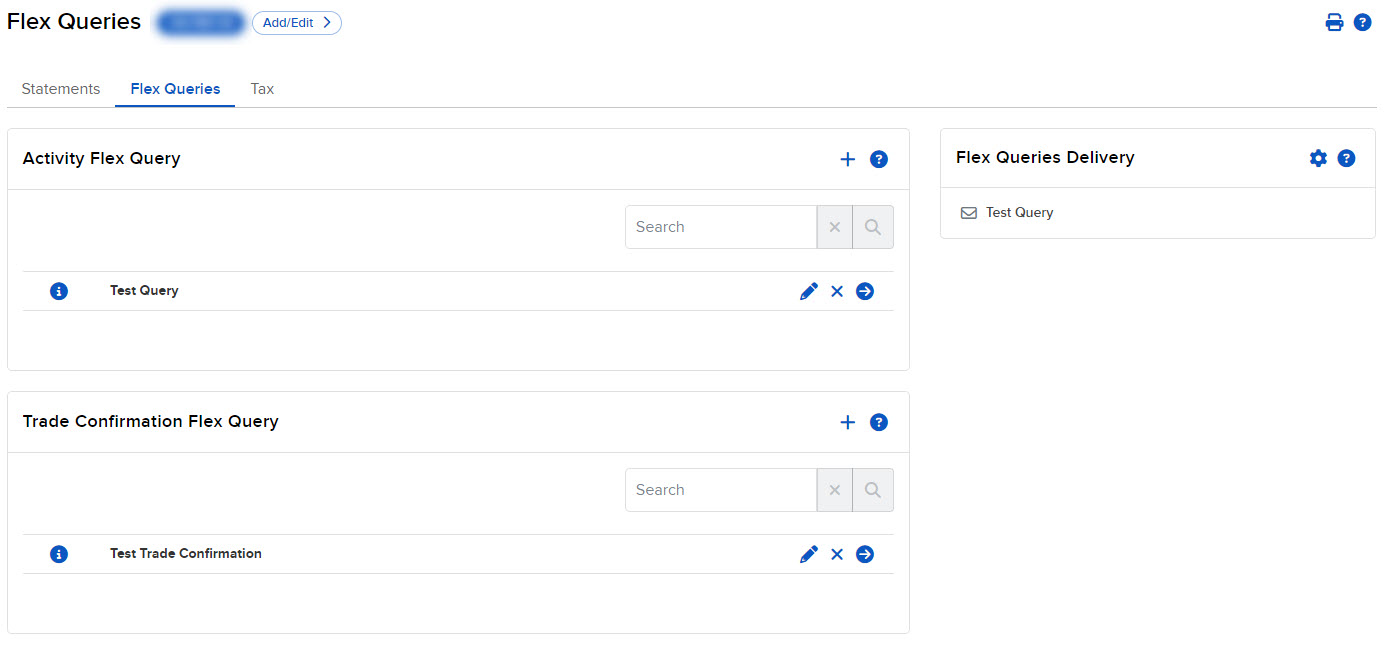
Flex Queries are highly customized report templates for Activity Statements and Trade Confirmation Reports. Flex Queries let you specify exactly which fields you want to view, the time period you want the report to cover, the order in which you want the fields to appear, and the output format, TEXT or XML, in which you want to save your report data for viewing in a program such as Microsoft Excel.
You can create multiple Flex Queries with different fields for each report. A Flex Query is different from an Activity Statement or a Trade Confirmation Report in that you can customize a Flex Query at the field level, allowing you to include and exclude detailed field information. Customized Activity Statements only let you include and exclude sections, while you cannot customize a Trade Confirmation Report.
Saved Flex Queries are available for the four previous calendar years and from the start of the current calendar year.
Professors Using Flex Queries for Rankings
For more granular, customizable rankings, professors can build a Flex Query report combining fields across the following categories:
Step-by-step: Building the query
1. Select these Flex Query sections (from the matrix):
- Net Asset Value (NAV) in Base
- Realized and Unrealized Performance Summary in Base
- Cash Report
- Trades
- Commission Details
- Transaction Fees
- Interest Accruals
- Open Positions
2. Run it periodically (weekly/monthly/end-of-semester) across all student accounts using the same query template.
3. Import into a spreadsheet or script (Excel/Python/R) and calculate metrics using simple formulas, e.g.:
|
Metric |
Formula |
|
Total P&L |
Realized + Unrealized (from Performance Summary) |
|
NAV Volatility |
STDEV of daily NAV % change |
|
Max Drawdown |
(Peak NAV − Trough NAV) / Peak NAV |
|
# of Trades |
COUNT of rows in Trades |
|
Trade Volume |
SUM(Quantity × Price) |
|
Total Fees/Commissions |
SUM(Commission) + SUM(Fee) |
|
Interest Paid |
SUM(InterestAccrued) |
|
Distinct Symbols |
COUNT UNIQUE(Symbol) |
|
Asset Class Breakdown |
COUNTIF/GROUPBY(AssetCategory) |
4. Build a composite grading rubric, e.g.:
|
Category |
Weight |
Metric Used |
|
Return |
30% |
Total P&L / Beginning NAV |
|
Risk |
20% |
NAV Volatility (penalize high risk) |
|
Trading Activity |
15% |
Reasonable trade frequency (not over trading) |
|
Efficiency |
15% |
Low commissions/fees relative to volume |
|
Diversification |
20% |
# distinct symbols / asset classes held |
Then normalize each student's score (e.g., percentile rank across the class) and combine into a final weighted grade.
One important note for the professor
This setup does not give risk-adjusted return metrics like Sharpe Ratio or true Time-Weighted Return out of the box — those require the daily NAV series (which the query does provide via Breakout by Day) plus a separate calculation step in Excel/Python. So the query gets you all the raw ingredients, but the professor (needs a short script/spreadsheet template to turn it into final grades.
Flex Query results can be scheduled and exported as XML or CSV for further analysis in Excel or other tools.
-
Best Practice: Professors typically share class-wide rankings with students through Blackboard or another preferred communication method, since students cannot view this data directly in the platform.