Chart Arithmetic
Instructions
You can add or subtract the bid/ask average prices for two or more contracts, and chart the sum as a single value.
To Chart Combined Contracts
-
Select an underlying and use the right-click menu to select Charts then New Chart.
-
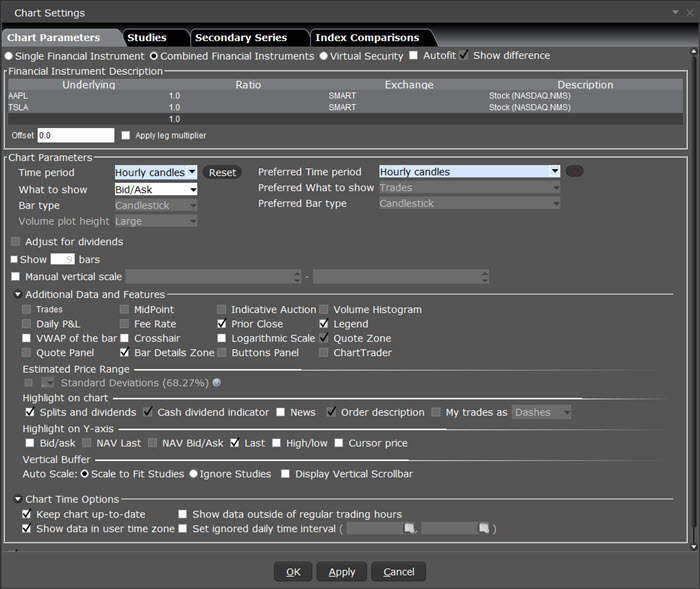
Select the Edit button followed by Chart Parameters
-
Select the Combined Contracts radio button at the top of the Chart Parameters window.
If the Combined Contracts selection at the top of the parameters window is not available, you will need to disable the last checkbox on the page, Bypass this dialog when opening a new chart which is enabled by default. Disable this feature and click OK, then create your new chart. The Combined Contracts feature will now be available.
-
In the contracts table, define multiple contracts.
-
To subtract a value, use the Ratio field to enter a minus sign in front of the ratio, or check Show difference at the top of the window.
-
If desired, enter an offset amount.
-
Choose the Time Period.
-
Click OK.

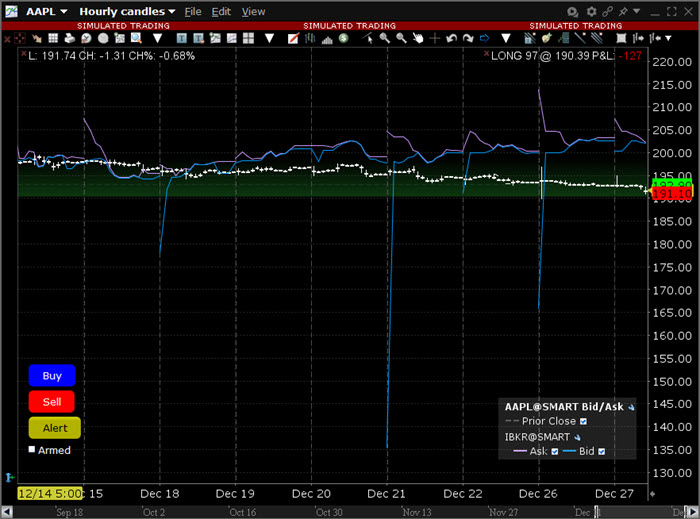
A Combined Chart Looks Like:

Autofit Combined Charts
The chart arithmetic feature includes the ability to mathematically calculate the ratios for one or more contracts to approximate as closely as possible the chart for a single contract or index. You can elect to show both the primary and the autofitted charts, or just see the difference by checking Show Difference. The ratios and offsets for the autofits are calculated using the algorithm for fitting least squares regression problems under non-negativity constraints. Details are described by Lawson & Hanson in "Solving Least Squares Problems."
To use this feature, please take the steps outlined below.
-
Check the Autofit checkbox at the top of the window. Use the Show difference checkbox to see a single autofitted chart equal to the difference between the primary chart and the autofit.
-
In the contracts table, define multiple contracts. The first instrument you list will be the primary, and those that follow will be autofitted to the primary.
You must either check the Autofit box before you list the instruments you want to chart, or select all underlyings you want to include in the autofit before you check the box.
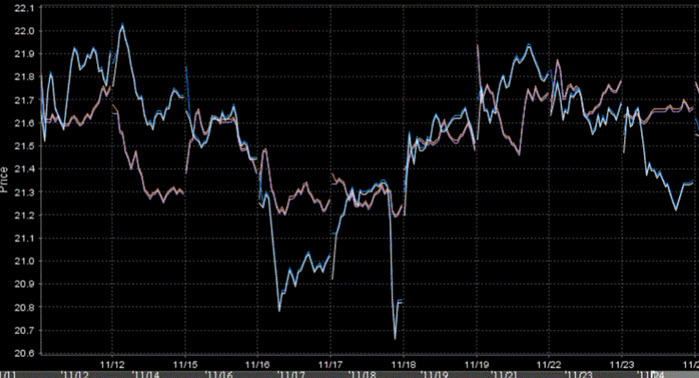
A chart using just Autofit looks like this:

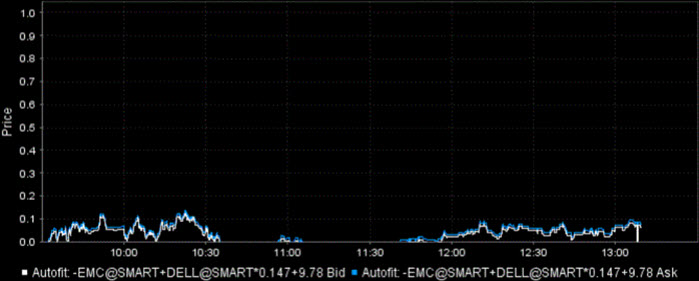
A chart using both Autofit and Show difference looks like this:
