Futures Term Structure
Instructions
View the real-time and historical term structure of futures prices with the Futures Term Structure window. This window displays a split chart that shows the real-time and historical settlement prices of the existing futures contracts for the given underlying (top chart) and the differences between the older settlement price curves and the most recent selected curve (bottom chart).
To View Futures Term Structure
-
Select a futures contract in a watchlist.
-
Use the right-click menu to select Charts and then select Term Structure. Note that if you don't see this command, use the down arrow to expand the list and view all available commands.
-
Alternatively, use the New Window Search field in Mosaic and start typing Term to see the full tool name.

-
-
The Futures Term Structure window will populate on your screen.

Data and Data Selection
-
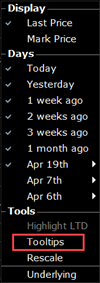
Use check boxes at the top to view Today and/or Yesterday's previous close data. Click "+" to add more historical data points from the past two years
-
Select up to five predefined historical dates and define three other custom dates.
-
Use the sliders along left and bottom frames or select any area on the plot by dragging your mouse to zoom. To restore, use the right-click menu and select Rescale.
-
Use the right-click menu to chose the data source. By default we display "Last Price" for Today and "Close Price" for historical dates. You can also select "Mark" price for Today. See related legend on the right top corner of the plot
Underlying Prices
The first node of a term structure series is the current or historical underlying index or stock price when it is available. The spot price is rendered by an unfilled symbol. Add horizontal markers at the current spot from the right-click menu by selecting Underlying. The current last price and price change is displayed in the right side of the window header (when available).
Difference Series Definitions
-
Between the Price and the Difference plots you can see labels for the currently selected difference definitions. Their border colors are the same as their difference series color.
-
You can change the difference series definition by clicking on the label. It will show a small popup where you can select the days (all the series that are selected for the Price Plot). Once you select the days pair it will change the currently selected definition to the new one (unless you selected a pair which is already selected, in this case it will just remove the edited definition)
-
Remove a definition and its series by clicking the "X" inside the color border.
-
Add a new definition by clicking on "+" and using the popup.
-
When you remove a date from the top check boxes it will remove all definitions that contained this date.
-
When you select a new date the window will generate the appropriate new definition depending on the configuration
-
The definitions you specify here will be kept for a newly opened Future term structure window or when you select a new future. It will save a definitions for the current Future Term Structure window just like the configurations once you close the
Highlights / Tooltips
-
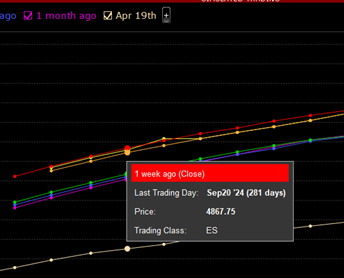
As you move your mouse over the plots, the data points of the closest 'Last Trading Day' (LTD) or 'Days to LTD' are highlighted with a bigger symbol. The highlighted values are also displayed in moving colored labels on the related axis.
-
Use the right-click menu and select "Highlight LTD" from the Tools section to display more information of the closest series. If this feature is disabled it may mean that you have Tool Tips enabled.
-
Use the right-click menu and select "Tooltips" to get more details of any given data points when you hover your mouse over it. Notice that 'Highlight LTD' is disabled when the tooltips are enabled
Configuration
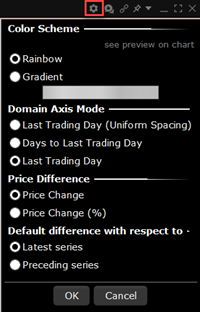
Use the Configure Wheel Icon in the top right corner of the window to manage:
-
Color scheme
-
Rainbow mode assigns a unique color to each series.
-
Gradient mode uses gradations of the main color you choose.
-
- Domain Axis Mode
-
You can change the display mode of the horizontal axis. It can display the absolute 'Last Trading Days' (uniform or proportional spacing) or the relative 'Days to Last Trading Day' in days.
-
- Price Difference
-
You can change the display mode of the vertical axis of the difference plot. It can display the real price difference of the selected two series or the percentage price change (as known as return).
-
- Default difference with respect to...
-
Based on the configuration of this section, the default difference series will be generated with respect to the latest (Today, if selected) series or it will generate incremental differences between the selected dates.
-