Portfolio Beta Weighting
Instructions
Information on Portfolio Beta Weighting have been listed below.
The sensitivity of an individual stock to the movement in the broader market is known as its beta. Stocks sensitive to market movements typically have high betas over time. Stocks that show low correlation with the market have low betas, while some may move broadly in line with the market as a whole. Stocks that move inversely to the market would have negative betas.
Risk Navigator measures beta-weighted performance, allowing traders to consider risk by measuring individual component correlation with a market index in order to estimate likely gains or losses in the event of a given move in the market. For the same portfolio of stocks, we can generate contrasting risk profiles by looking at risk units in delta-terms versus beta-terms, which shows the aggregate sensitivity of a portfolio to a market index.
To enable Beta Weighting, please take the steps outlined below.
-
From the Risk Navigator View menu, select Beta Weighted Portfolio.
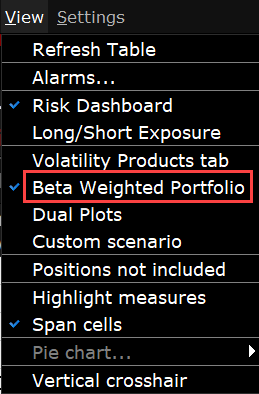
Beta-weighting allows traders to contrast the likely performance of a delta neutral portfolio (should the component pieces behave in the future as they have in the past) with respect to a specific benchmark index or reference contract. One might expect a long high-beta portfolio to perform better when considering beta-weighting in the event of a market rise in comparison to its performance when assuming it is equally delta-weighted. Conversely, its beta-weighted performance should be expected to be worse for a market fall in comparison to an across the board equal-weighted decline for all component pieces.
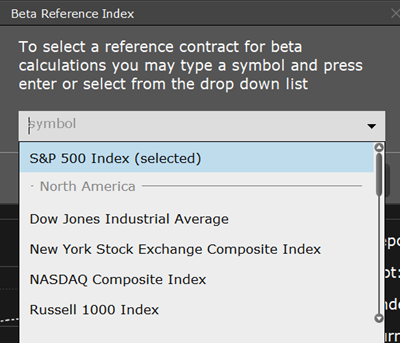
The first time you enable Beta Weighting from the View menu, the Beta Reference Index box is displayed. This allows you to select a benchmark index other than the default S&P 500, or manually enter a ticker symbol and define a specific stock as the reference contract.
Note: Reference contracts are associated with a specific portfolio, which means that you can use different reference contracts in your different portfolios.
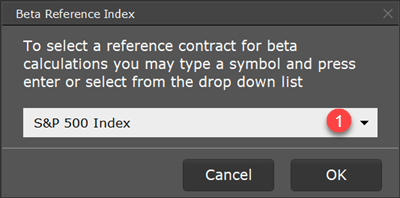
1 - Choose a new reference index from the drop-down list or enter a ticker symbol to use a specific asset as the reference contract.
You can elect to modify the reference contract at any time by clicking the current Beta Reference symbol in the information bar along the bottom of the Risk Navigator.
You can modify the calculated beta values for any contract using the Manual Beta Editor, or by clicking directly into the beta field for any stock position.
Note: There can only be one beta value per contract/reference index across all portfolios. This means that if you modify the beta value for contract XYZ in a portfolio that uses the default S&P 500 index as the reference index, the beta value for XYZ in any other portfolio that uses this reference index will also change.
Edit beta using the Manual Beta Editor
-
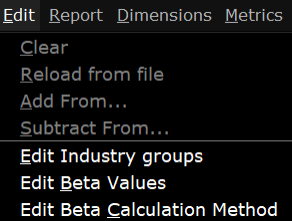
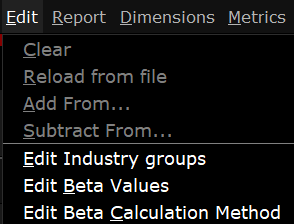
From the Edit menu select Edit Beta Values.
-
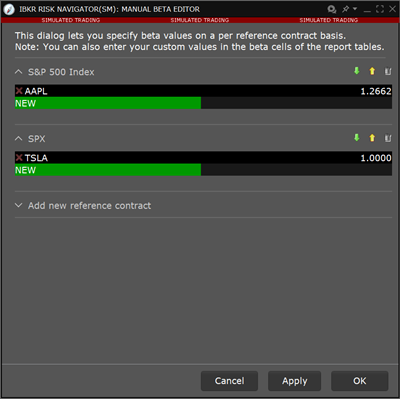
In the Manual Beta Editor, add an underlying in the current Reference Contract section by clicking the green NEW button. The calculated beta value is displayed.
-
Click in the Manual Beta field and enter the desired beta value. Hit Enter.
-
If desired, click the Add new reference contract button to add a new section for other reference contracts (you might do this if you had multiple portfolios that each used a different reference contract).
-
Click Apply to apply the value to the report and leave the Editor open. Click OK to apply and close.
Change Beta Directly in Report
-
Click in the beta field to enter your own beta value.

-
Right-click in the edited beta field (identified with red text) and select Remove Manual Beta to reset the value to the calculated beta.
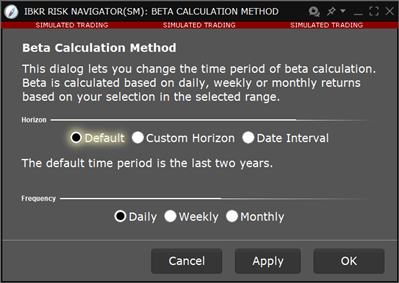
Beta is calculated based on equal weighted daily returns over the last two years. The Beta Calculation Method Editor allows you to change the default two-year period relatively from the current date, or using a specified date range that contains a minimum 30-day period.
To open the Beta Calculation Method Editor
-
From the Risk Navigator Edit menu select Edit Beta Calculation Method.
-
To change the time period relative to today, select Custom Horizon and then choose the number or units and the unit (years, months or days).
-
To change the time period to use a specific date range, select Date Interval and then define the Start and End dates.
Add or remove beta risk-related fields using the Beta Risk section of the Metrics menu.
Note: You can add one or multiple beta risk fields to your equity reports, but to enable beta weighting throughout the portfolio including the Risk Dashboard and P&L Graph, select Beta Weighted Portfolio from the View menu.

| Field | Description | Notes |
|---|---|---|
| Long/Short | Shows the specific value for all long positions and for all short positions to allow you to see the aggregate for both. Note that the other field for these values provides the net. | |
| All | Add all Beta Risk fields. | |
| None | Remove all Beta Risk fields. | |
| Beta | The ultimate underlying’s raw beta at the ultimate underlying level (for reports with drill-down capability) and at the position level for stock positions. This means that for underlyings with both stock and option positions, the stock beta is displayed. Beta can be used to estimate the expected return on an asset given the return on a statistically related asset. | |
| Correlation | Provides the correlation between the contracted and the user-selected reference index. | |
| Weight | The position weight used for the portfolio beta calculation (shown in the Risk Dashboard). | |
| Weighted Beta | The contribution of a given product to the total beta of your portfolio. | The total weighted beta value is also displayed in the "Portfolio Beta" field in the Risk Dashboard. |
| SPX (Beta Weighted) Delta |
The index-equivalent delta position for the stock. Calculation: Delta x dollar-adjusted beta (adjusted by ratio of close prices). |
The reference contract is displayed in the title of this field; this example uses SPX as the reference index. |
| SPX (Beta Weighted) Delta Dollars | This is a measure of the change in the position’s exposure in currency terms resulting from the change in the market (the reference contract). The Beta Weighted Delta Dollar reading multiplies the Delta * the position size to show the relative significance of any position translated in dollar terms and is the expected change in the value of the stock should the benchmark increase or decrease in value by $1.00 | |
| SPX (Beta Weighted) Delta Dollars % NLV | The ratio of the current beta weighted delta dollars to the portfolio's total net liquidity. | |
| Beta Delta Dollars | Exposure weighted by the unadjusted beta of the given position. For stocks, this is sometimes called the Beta-Adjusted Market Value. | |
| Beta Delta Dollars % NLV | Delta dollars weighted by the unadjusted beta of the given position as a percentage of the Total Net Liquidation/GMV of the entire portfolio. This is also referred to as the Beta-Adjusted Exposure or Beta-Adjusted Market Value in Percentage. | |
| Beta Delta | Beta-adjusted delta position, which is the delta position weighted by the unadjusted beta of the given position. |
You can also change the calculation used for all calculated fields from NLV to GMV. From the Settings menu select Percentage Column Calculations.
The Portfolio Relative P&L graph illustrates how the total value of your portfolio for a specific asset class (or a subset of your portfolio) will change, based on a percent change in the price(s) of the underlying(s). Available settings may change based on the asset class displayed.

1 - Change the range for the underlying price change shown on the horizontal axis. The default value is +/- 30%.
2 - Change plot aggregation when Beta Weighted Portfolio is enabled (from View menu)
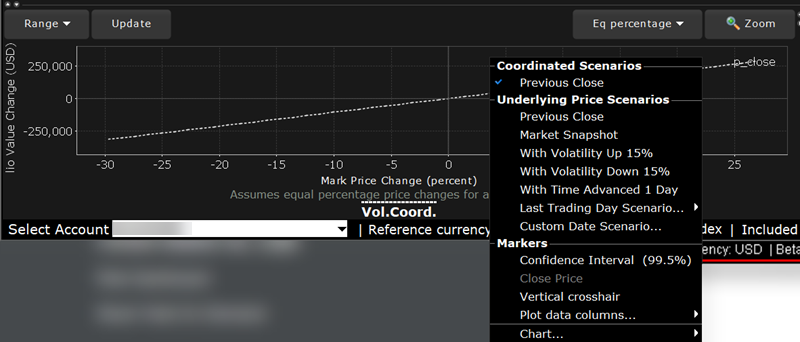
Use the right-click menu to create date scenarios, add or remove time and volume variables, enable the vertical crosshair and set data column slicers.
The image above shows the portfolio relative P&L for an equity portfolio, based on the value All Underlyings selected from the Underlying list in the Report Selector.

For a single underlying, you can toggle between showing the absolute price or showing the underlying price change as a percent. Click the price label below the horizontal price axis to select a display type.
Note that for leveraged ETFs, the Risk Navigator moves them by their target performance ratio in the aggregated P&L graph. For example, for an index and its triple inverse ETF, to the +10% P&L it adds the index P&L at 10% to the ETF P&L at -30%. When either one is plotted individually, it shows their own P&L, but it shows the index on a +/-30% range and the ETF on a +/-90% range.
Beta analysis in
The Confidence Interval, shown within the yellow vertical lines, illustrates the worst-case loss over a one-day period with a default 99.5% confidence level. Use the Confidence sub-command on the Settings menu to toggle between 95%, 99% and 99.5% confidence levels. Turn the Confidence Level brackets on or off using the Confidence Interval command on the right-click menu.
For portfolios containing options or volatility products (like VIX or its derivatives), vol-coordinated price changes show the effect of a change in market price level and a corresponding simultaneous change in volatility level. In scenarios where stock prices are down X%, vols are assumed to simultaneously increase by up to (10*X)% for short-dated options, decaying gradually to (2*X)% for options with longer expiries. Conversely, in scenarios with stock prices up X%, vols are assumed to be down X% for short-dated options, decaying to (X/5)% for longer expiries.
Curves generated using these coordinated volatility changes will be marked "Vol.Coord.", and will be displayed together with a tool tip detailing the scenarios used.

Use the Vol-up by 15%*, Vol-down by 15%* and reduced time to expiry by 1 day checkboxes in the right-click menu to view the plot under different scenarios to help you visualize the volatility and time risk in your option positions. While you can elect to display the base P&L using both the previous day’s closing price and the most recent dynamic price, the volatility and time variables are always based on the previous close.
*The Vol Up and Vol Down commands increase/decrease projected volatility in relative percent change. Relative percent change is calculated by multiplying the current implied volatility by 15%, and adding/subtracting this value to/from the current implied volatility. For example, if the current implied volatility of an option is 10%, a 15% relative increase would result in an implied volatility of 11.5%, calculated as follows: 10 + (10 * 0.15) = 11.5% . If the current implied volatility of an option is 42.45%, a 15% relative decrease would result in an implied volatility of 36.082%, calculated as follows: 42.45 - (42.45 * 0.15) = 36.082%.

1 - Activate the vertical crosshair from the right-click menu to get mouse-over help at any price-change percentage point.
Note: For Bonds, the P&L plot is based on the interest rate change.