Option Strategy Lab
Enter your price or volatility forecasts for an underlying and the Option Strategy Lab will return a list of single and complex option strategies that will potentially profit based on the forecast.
To open the Option Strategy Lab
- From within Mosaic, use the New Window drop-down and select Option Analysis and then Option Strategy Lab.
- From within Classic TWS, use the Trading Tools menu and select Option Strategy Lab.
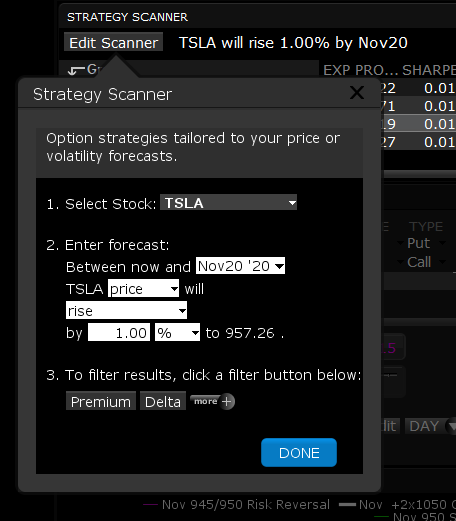
When you first open the Option Strategy Lab, the Strategy Scanner opens to allow you to enter your forecast data.
To populate the Option Strategy Lab
In the Strategy Scanner, select an underlying.
Define your forecast, including:
- The range, between now and a selected last trading day.
- Price or Volatility as the forecast driver.
- The predicted action of the price or volatility. Choose from:
- Drop
- Rise
- Be rangebound
- Move at least
- The increment and unit (choose from value or percentage)
If desired, filter your results by Premium, Delta, Strike or Last Trading Day. You can select multiple filters and define multiple values within each filter.
Click Done to populate the lab.
Order Entry
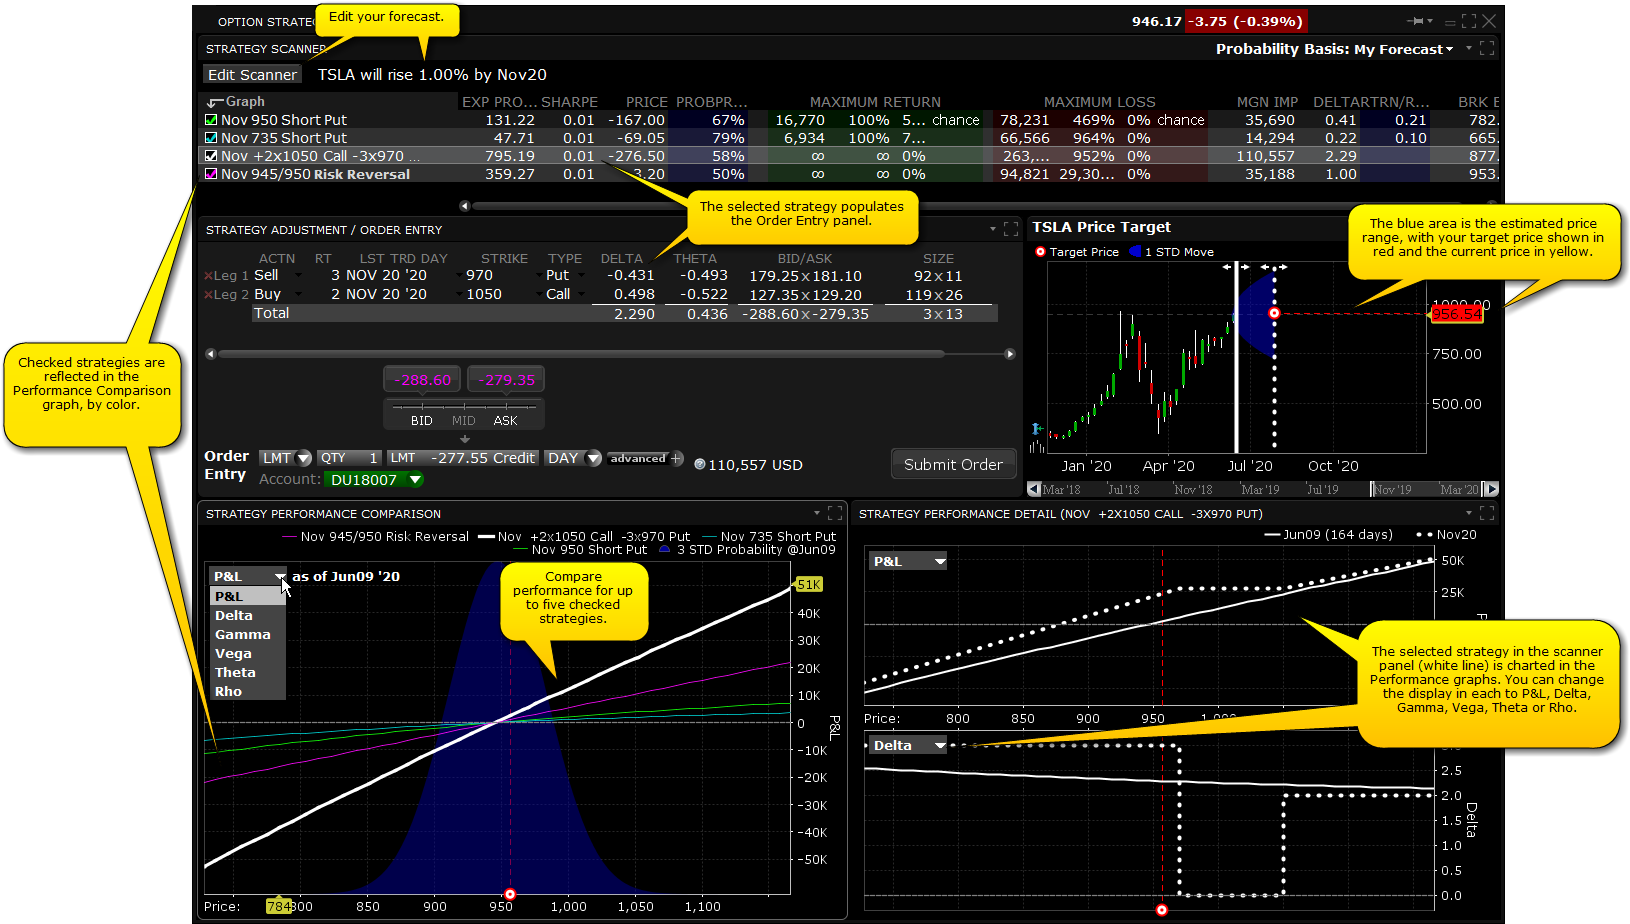
The strategy selected in the scanner populates the Order Entry panel. Each time you select a new strategy the Order Entry panel is repopulated.
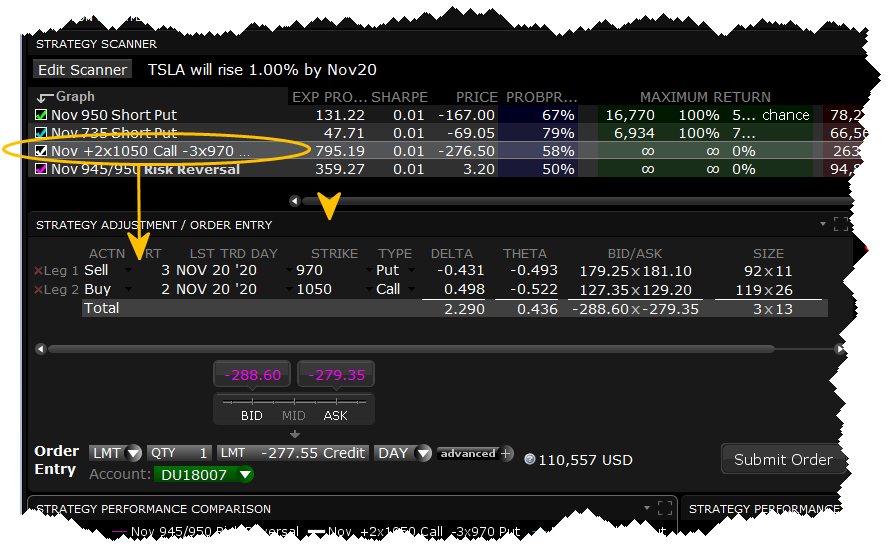
Modify order parameters in the Order Entry section at the bottom of the panel, and click Submit to trade the strategy. Before you submit the order, you can analyze the forecast-based strategy using the charts and graphs.
Analyze Strategies in the Scanner
Based on your forecast, the scanner returns a list of options or complex option strategies that will potentially be profitable if your forecast is correct. Some fields in the scanner include:
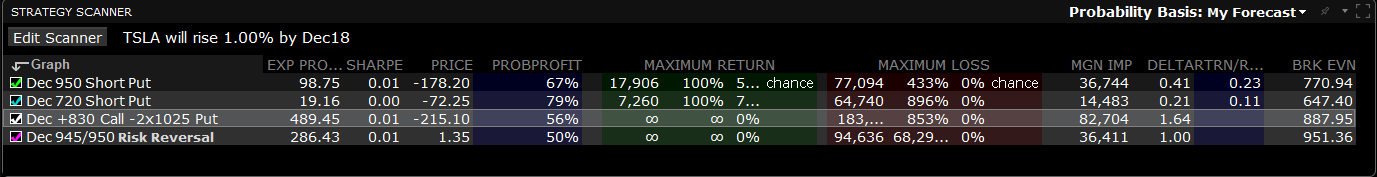
Expected Profit- Expected profit as implied by the customer Probability Distribution.
Sharpe Ratio - The measure of excess return (the risk premium) per unit of deviation for the strategy.
Return/Risk Ratio - The ratio of the max potential gain to the max potential loss.
Probability of Profit - The market implied probability of any gain.
Maximum Potential Gain
Maximum Potential Gain as a Percentage of your Investment
Maximum Potential Loss
Maximum Potential Loss as a Percentage of your Investment
Break Even Point - the underlying price(s) required for a strategy to break even.
Add more fields by clicking the Configure wrench icon and then selecting Configure Columns.
Analyze the Price Target
The Price Target chart shows the current underlying price highlighted in yellow, and the target price based on your forecast in red.
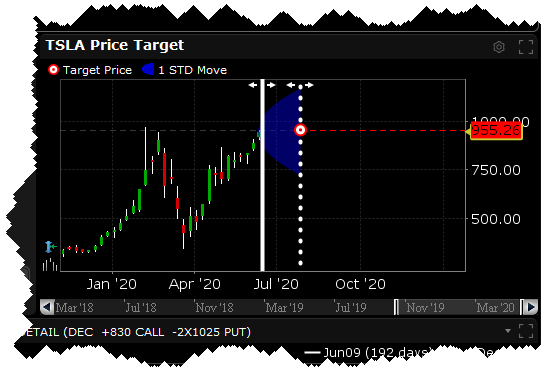
The blue shaded area represents the estimated price range to one standard deviation. Drag the dotted line to change the expiration date.
Compare Strategy Performance
Each strategy checked in the scanner is represented in the comparison chart.
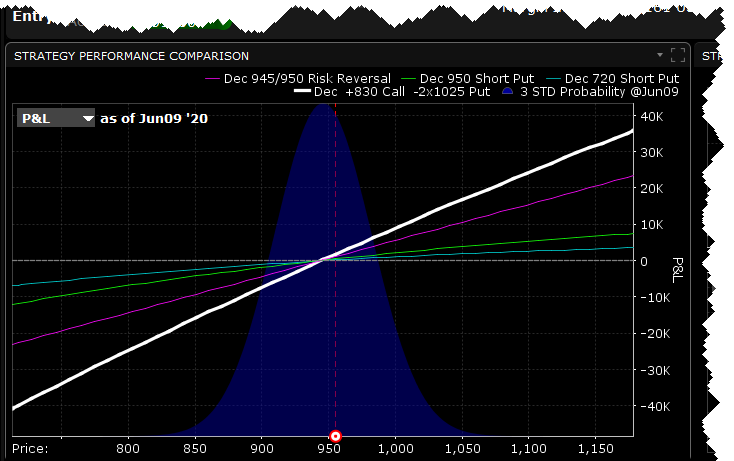
The chart is set to today's date by default. Use the drop-down to modify the display to show P&L, Delta, Gamma, Vega, Theta or Rho.
Strategy Detail
The Performance Details charts provide a close-up look at the option or strategy selected in the scanner. Use the selector to change the comparison category.
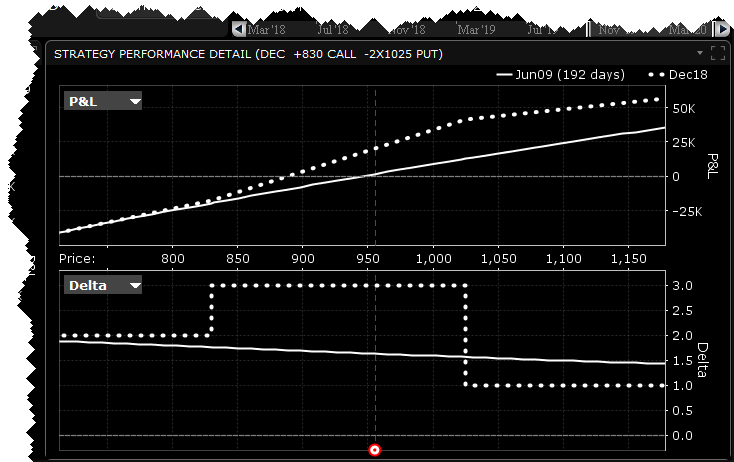
The last trading day is driven by the date in your forecast.
