Probability LabSM (Patent Pending)
Use the Probability Lab to customize the Probability Distribution based on your price or volatility forecast for the underlying ticker. Analyze and trade any of the option combinations suggested from your probability distribution.
To open the Probability Lab
- From within Mosaic, use the New Window drop down.
- From within TWS, use the Trading Tools window.
To use the Probability Lab
Enter a ticker and select a last trading day. The market defined Probability Distribution (PD) is built.
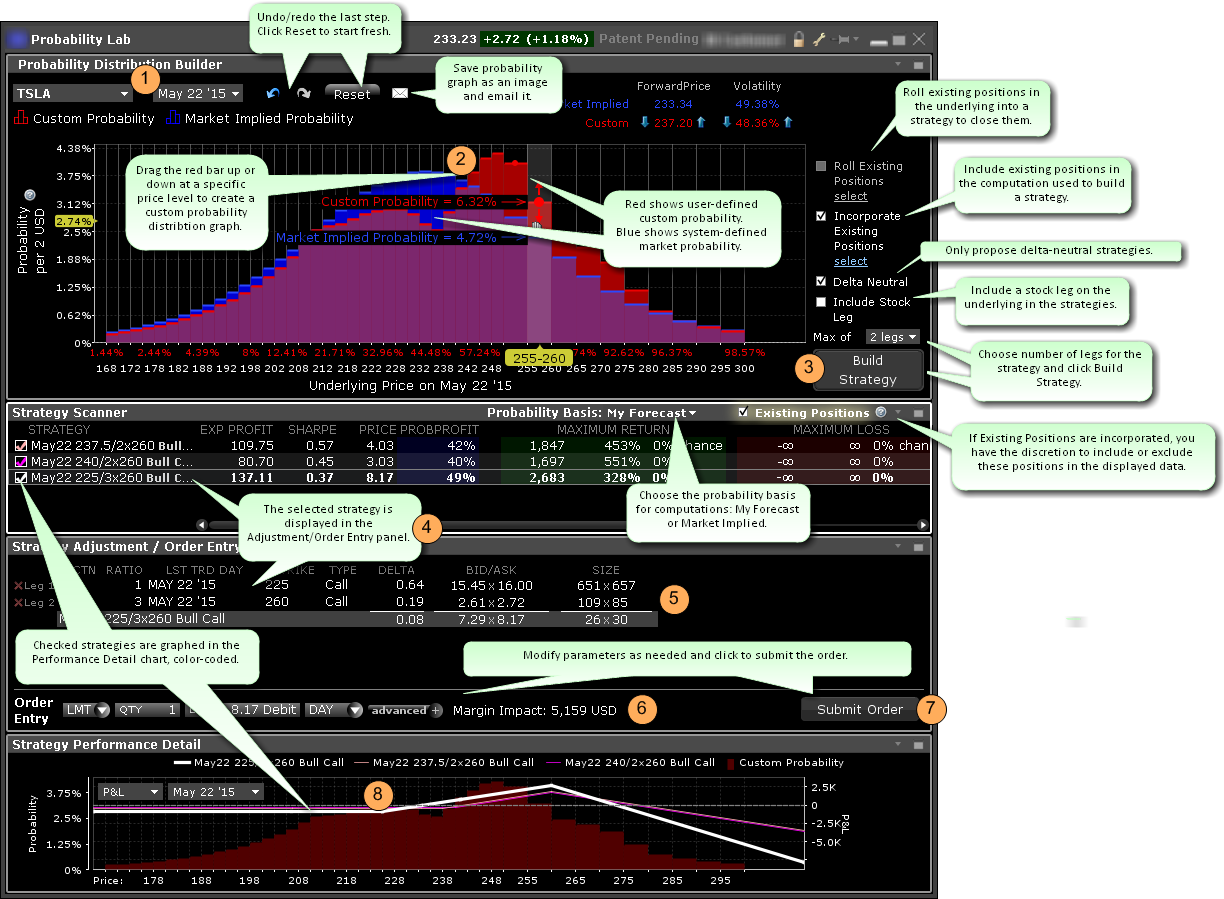
In the Probability Distribution Builder, grab the red bar in any price interval and pull it up if you believe there is a higher probability of the stock price ending up in that price interval at the expiration date specified. Pull it down if you believe there is a lesser probability of the stock price ending up in that interval at the expiration date specified.
All probabilities must add up to 1.00 so you will see the other levels adjust when you make changes in any price interval.
You can also adjust the probability using the up/down arrow icons near the values, or by dragging the hand icon to the left or right within the distribution graph.
When you are satisfied with your custom PD, specify desired parameters, select the minimum number of legs you want in your option strategy and click Build Strategy.
- Roll Existing Positions - When applicable, allows you to select existing positions in the underlying to include in the strategy. The Strategy Builder will attempt to create a strategy that gets you out of the selected position. Only positions that expire before the selected last trading day will be displayed, and only two positions can be rolled. If the user-defined max number of legs below is too small, it will be adjusted. Cannot be used in conjunction with Incorporate Existing Positions feature.
- Incorporate Existing Positions - Check to have your existing positions in the underlying included in the computation used to build a strategy. Once you have built the strategies, you can view the data for the strategies both with and without the selected existing positions being included by checking/unchecking the "Existing Positions" feature in the blade of the Strategy Scanner. Cannot be used in conjunction with Roll Existing Positions feature.
- Delta Neutral - Check to only build strategies that are delta neutral.
Include Stock Leg - Check to have the underlying stock included as a leg in the returned strategies.
The Strategy Scanner (in the panel below the PD Builder) will display three potential combination option strategies that complement your customized PD. For each strategy (and based on your custom PD) the selector displays the Expected Profit, Sharpe ratio (which shows the ratio of expected profit to variability of outcome), net debit or credit, percent likelihood of profit, max potential profit and loss and the associated probabilities, and the margin requirement if you were to trade the strategy.
To create an order, in the Strategy Scanner select the strategy. To view color-coded representations in the Strategy Performance Detail graph, check the strategy.
- Probability Basis - Choose the probability basis for calculations using the drop down selector.
- Existing Positions - If you have elected to Include Existing Positions when building strategies, you now have the option to view data (including P&L in the performance details graph and data point in the strategy scanner) both including and excluding your existing positions in the underlying using the Existing Positions checkbox that will display next to the Probability Basis drop down list. Check to include; uncheck to exclude.
In the Strategy Adjustment/Order Entry panel, adjust any parts of the strategy by clicking in a field in the leg you want to modify. For any leg, you can modify the action, ratio, last trading day, strike or type.
Once the legs are defined, use the Order Entry line to modify any order parameters. Use the advanced order area to create a hedging stock order and to attach order attributes including iceberg and all or none.
When the order is ready to be sent, click Submit.
Use the Strategy Performance Detail graph to see the predicted profit or loss that would result from the selected trade if your forecast is accurate, along with the associated probability that corresponds to each price point. Use the drop down list to select Delta, Gamma, Vega, Theta or Rho for display.
