Volatility Skew
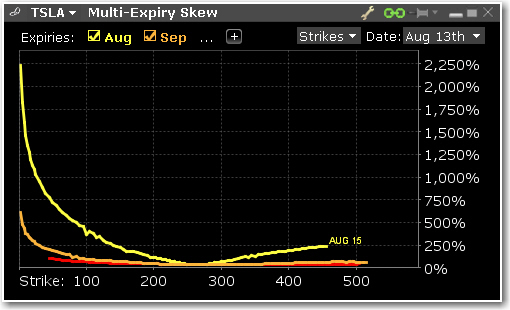
Multi-Expiry Skew
Displays the “volatility smile” created by the premium paid for options at selected expirations. Because an option’s premium is significantly comprised of the reading of implied volatility, an option trader is concerned by the respective cost of calls and puts at strike prices above and below the prevailing price of the underlying shares. When investors are more willing to pay higher premiums for in-the-money calls or out-the-money puts, the volatility curve may show a skew to price points below the prevailing share price. Conversely if options are priced higher for out-of-the-money calls and in-the-money puts, the volatility curve might be skewed higher to points above the prevailing share price. Use the Configure Wrench icon to change between Multi-expiry Skew, Time Lapse Skew (described in #4 below) and Skew Comparison (which allows the user to view the skew on a specified expiration date for the ticker and its industry comparables, any of which can be unchecked above the plot. Because we could be viewing stocks or an index with hugely different prices, the x-axis defaults to Moneyness rather than any individual share price).
You change the display for Multi-expiry and Time Lapse skews to compare Moneyness or Strike. Moneyness is the position of the strike to the underlying, while the Strike option will display the actual set of available strike prices on the x-axis. Use the Custom Calendar drop-down menu in the upper right of the screen to drive the same view to any available prior date. The user can then compare how long a particular condition may have been in place. Note also that the display can be changed between Moneyness and Strike using the Configure Wrench icon.
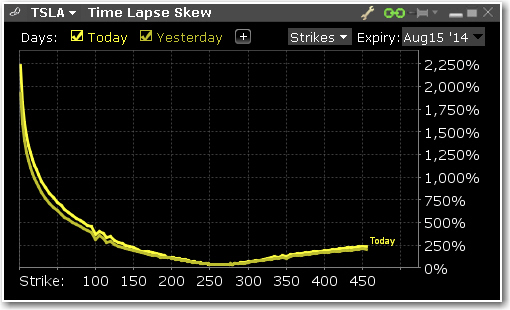
Time lapse Skew
An option trader may be interested in knowing how such a price skew has evolved. By using the Time Lapse Skew panel, the user can plot the current volatility skew for a selected expiration and compare to any prior period reading of one day, one, two and three weeks and one month ago. This allows investors to identify changing conditions in the option market or perhaps to identify a catalyst that caused skew to occur or disappear.
See the complete Volatility Lab.