Charts Summary
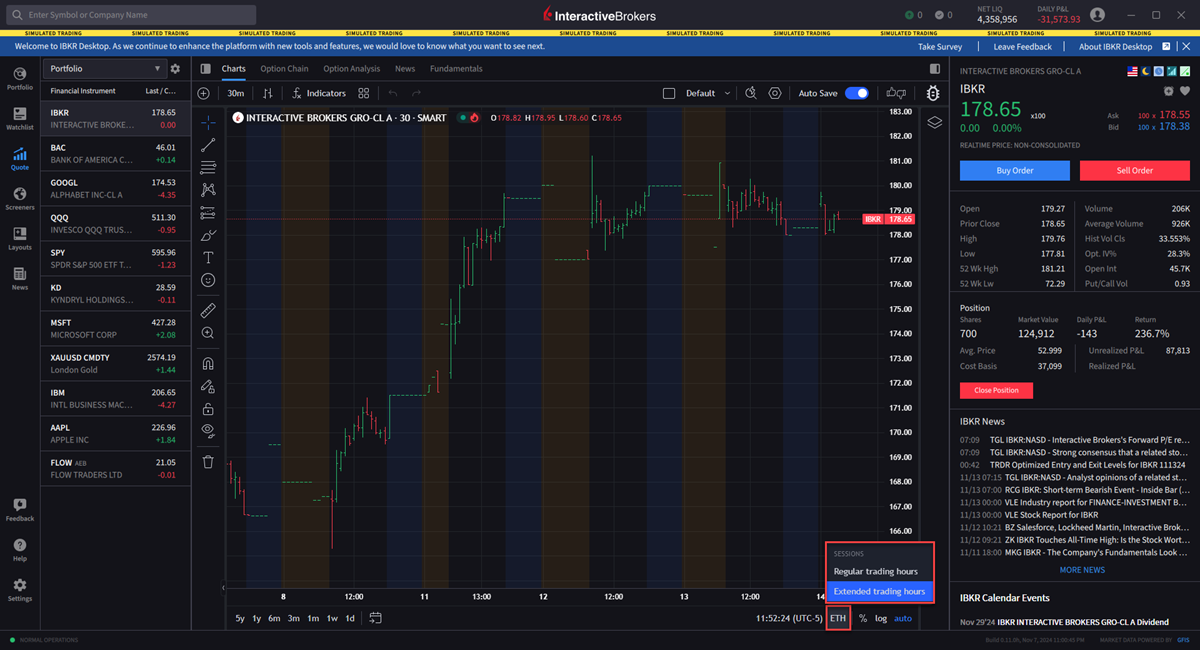
Access Advanced Charts within IBKR Desktop to monitor asset prices. You may change the time frame displayed as well as add technical studies, draw trend, and Fibonacci lines.
Instructions
Time
You may change the time period displayed from the lower left of the chart by clicking on any of the desired time period buttons.

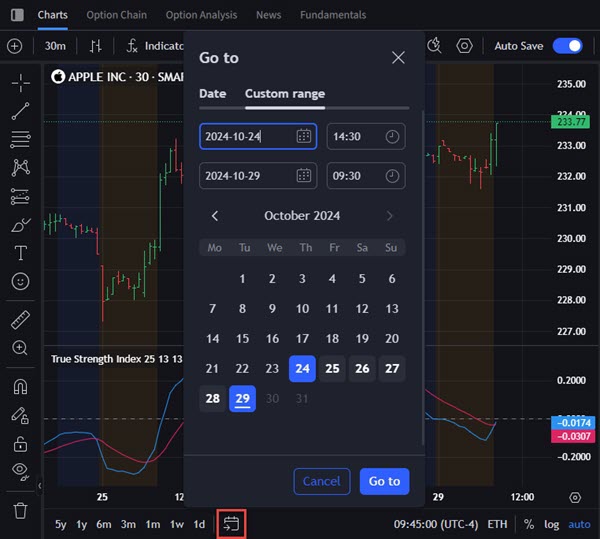
To choose a specific date or custom date range, select the calendar icon and choose a desired date.
Additionally, you may change the periodicity of the chart display from intraday to daily, weekly etc by selecting the time frame in the top left corner.
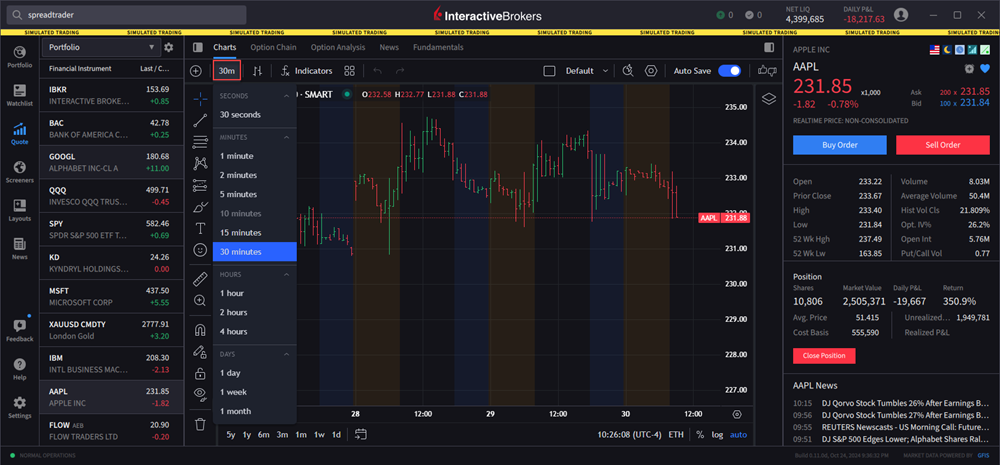
Chart Type
To change the chart type, you may choose from the icon an array of different chart types, from Bars, Candles, Hollow Candles, Volume Candles, Lines, etc.
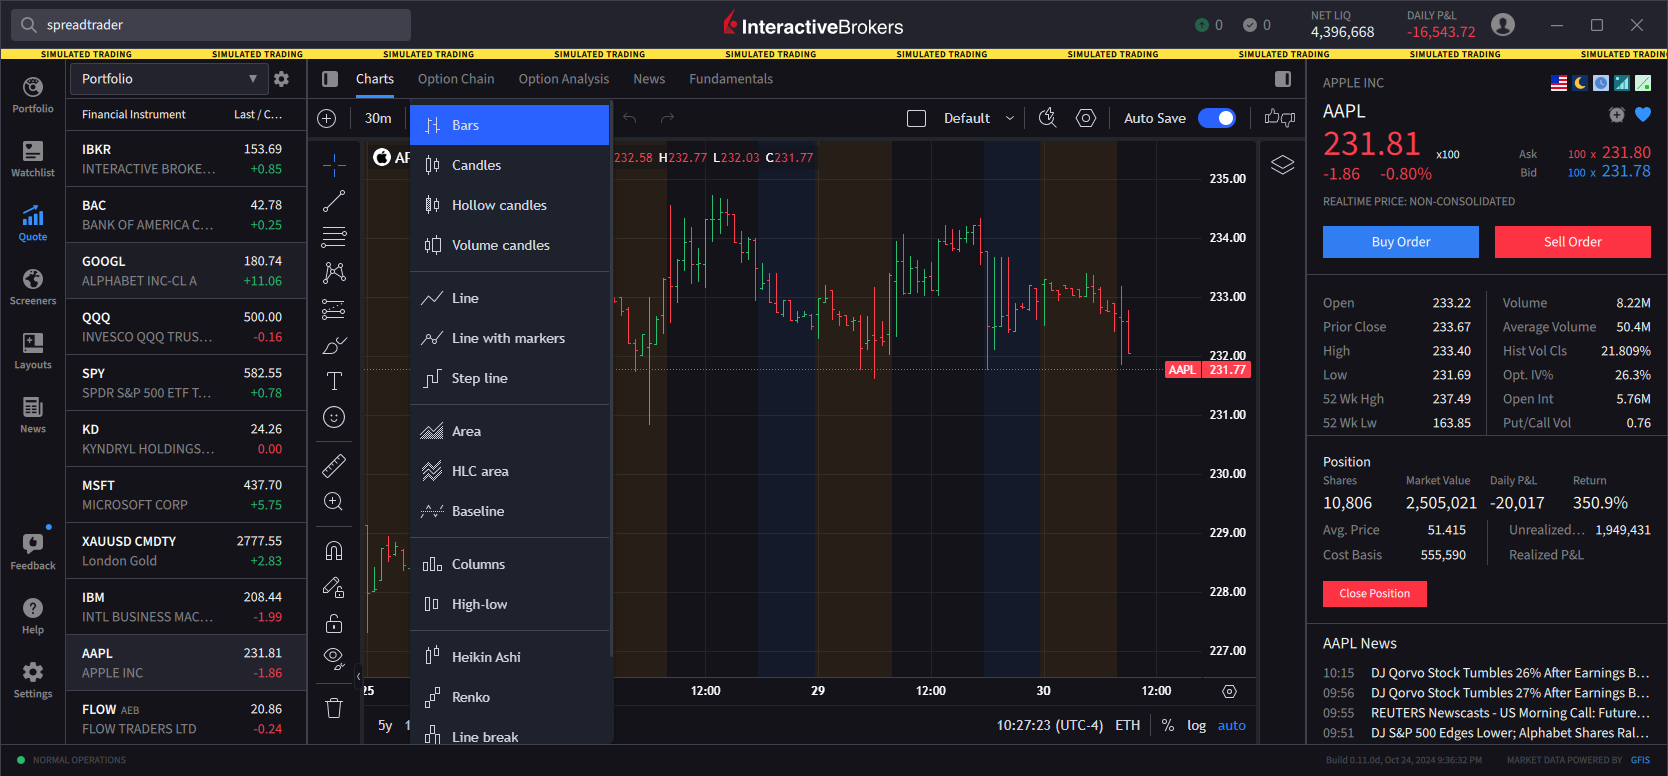
Chart Indicators
You may add chart indicators by clicking the indicators button and selecting or searching for a study.
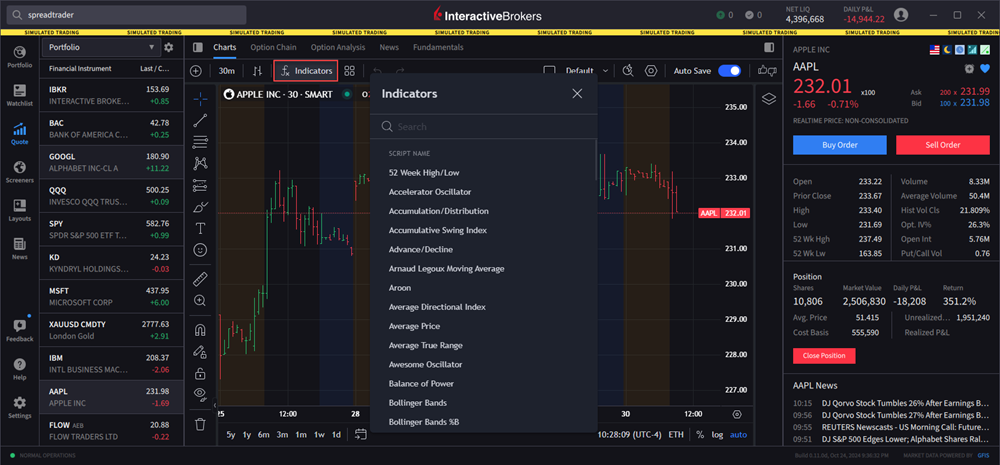
Once the user has added a series of indicators to a chart, it may be saved as an indicator template by tapping the four-squares icon and entering a name followed by ‘save’. Saved templates may be accessed by clicking this icon later.
Drawing Tools
Drawing tools are concealed behind a blue arrow along the lower left edge of the chart. Click that to expand the drawing tools panel.
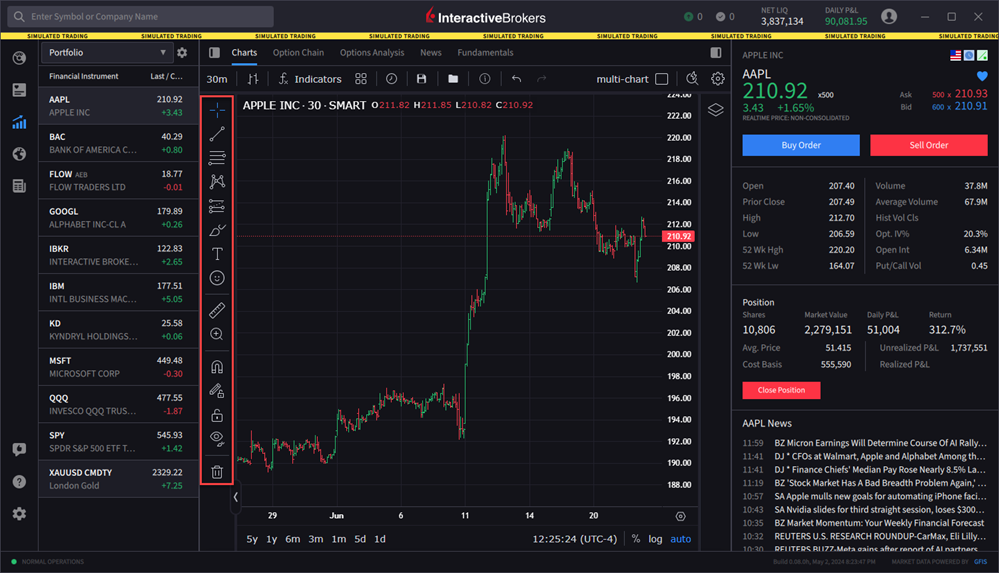
Use the tools to draw Fibonacci Retracement, Trend Lines and more. Hold your mouse over an icon to see the extended tool menu when applicable. To remove drawings and indicators from the display, the user would right click on a trend or Fibonacci line and select ‘remove’.
Hot News
Hot news icon displays the latest news stories relevant to the specific symbol shown on your chart.
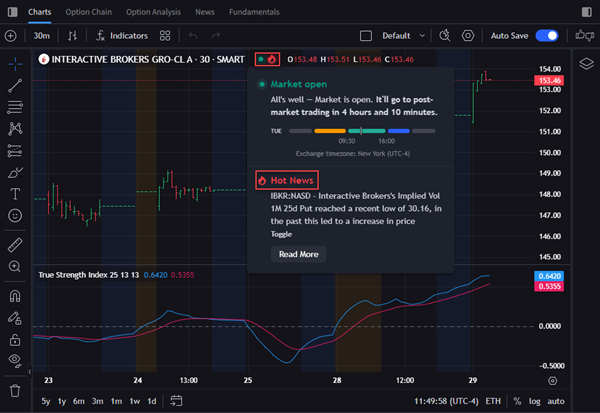
Chart Customization
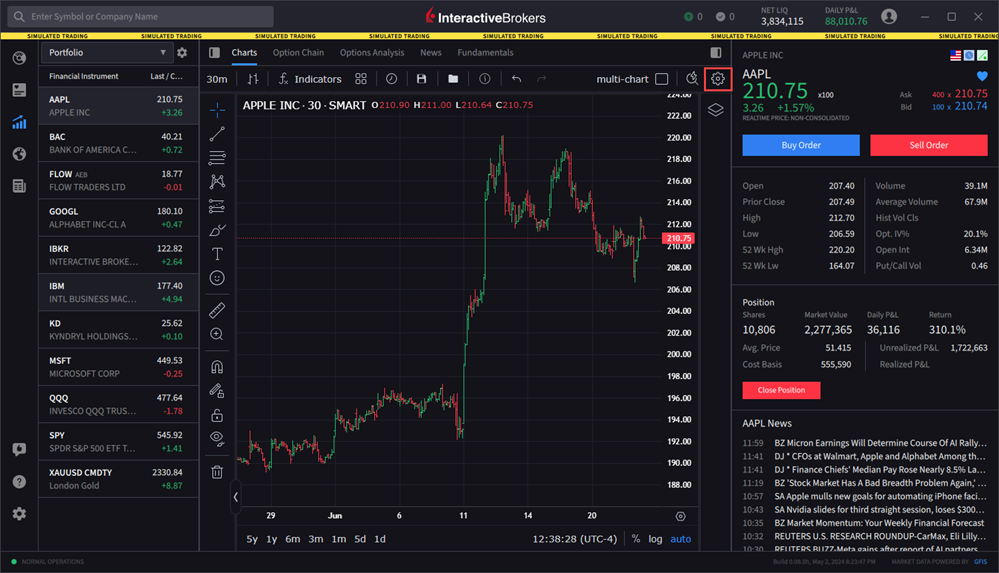
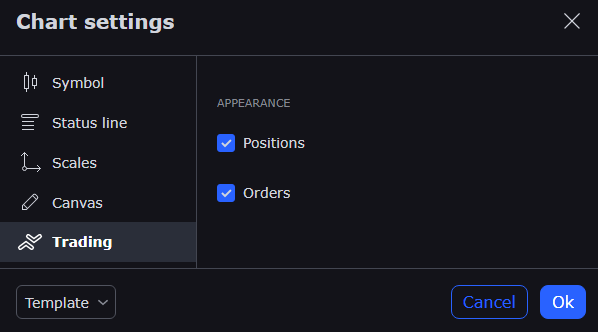
Click the gear icon on the top right above the chart for customization options, such as changing colors, labels, background, gridlines and more.
Enlarge Chart
-
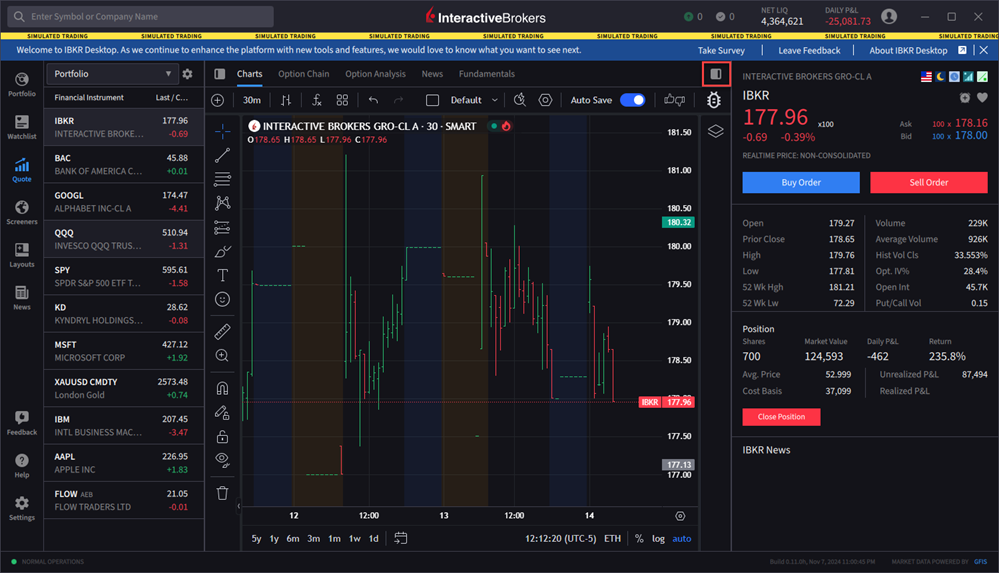
Use the sidebar icons
 to expand the chart on one or both sides.
Save a Chart
-
Click the “save” icon used to Save Chart Snapshot from the icon menu along the top of the chart.

-
Provide a name for this saved chart.
This will save every aspect of the chart window including the multi-chart layout and all instruments, indicators, time periods, intervals etc.
-
When you want to use these saved settings, please take the steps outlined below.
To load a Chart Snapshot
-
Click the folder icon to the right of the snapshot icon to Load Chart Snapshot and select the snapshot you want to load.

Outside RTH
You can enable "Outside RTH" (outside regular trading hours) in your chart to see how an asset trades during pre- and after-market hours.
-
At the top of the chart, click the clock icon to enable/disable Outside RTH.
Note: This icon is available on Daily (1 day) or greater intervals charts. For less than Daily Intervals, please see the Extended Trading Hours feature.
