Risk Navigator Reports
Instructions
The Risk Navigator Report Information has been listed below.
| Report | Find on These Product Tabs |
|---|---|
| Portfolio Report | Equities, FX, Commodities, MoneyMarket, Structured Products, Volatility Products |
| Risk by State Report | Bonds |
| Risk by Issuer | Bonds |
| Risk by Country Report | Equities, Bonds |
| Risk by Position Report | Equities, Bonds, FX, Commodities, MoneyMarket, Structured Products, Volatility Products |
| Risk by Underlying Report | Equities, FX, Commodities, MoneyMarket, Structured Products, Volatility Products |
| Plot Data by Underlying | Equities, FX, Commodities, MoneyMarket, Volatility Products |
| Risk by Industry Report | Equities,Bonds, Structured Products, Volatility Products |
| Measure by Underlying and Maturity | Equities |
| Measure by Price Change and Volatility Change | Equities |
| Portfolio Statistics Report | Equities, FX, Commodities, MoneyMarket, Structured Products, Volatility Products |
| Value at Risk Report | Equities |
| P&L Pie Chart | Equities, FX, Commodities, MoneyMarket |
Use the Risk Navigator Report Designer to quickly and easily configure all reports from a single window. Because the Risk Navigator reports are separate and unique, adding a field to one report does not add the field to all. The designer allows you to add fields to your reports without opening and modifying each report individually.
To open the Report Designer, please take the steps outlined below.
-
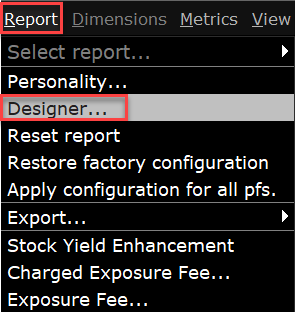
From the Risk Navigator Report menu, select Designer.
-
The Report Designer configuration page will appear in which you can configure all reports.
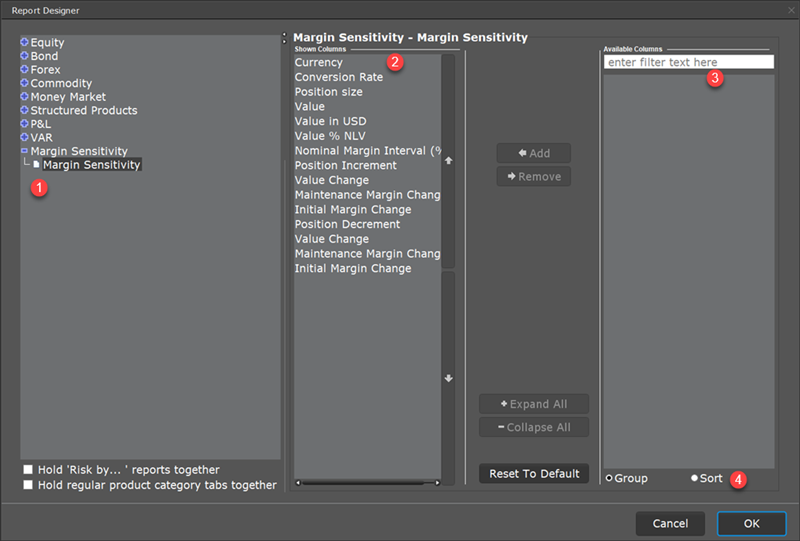
1 - Select a report from the left hand side.
2 - Navigate to the Shown Columns section to view fields that are already displayed in your report.
3 - View available columns can be added to the report. You may also remove, and rearrange fields.
4 - Use the sort selection to list all available fields alphabetically.
You can apply a market outcome scenario (calculated in the Measure by Price Change and Volatility Change report) to any of the other risk reports using the drill through command on the right-click menu.
To apply market outcome scenarios to other reports, please take the steps outlined below.
-
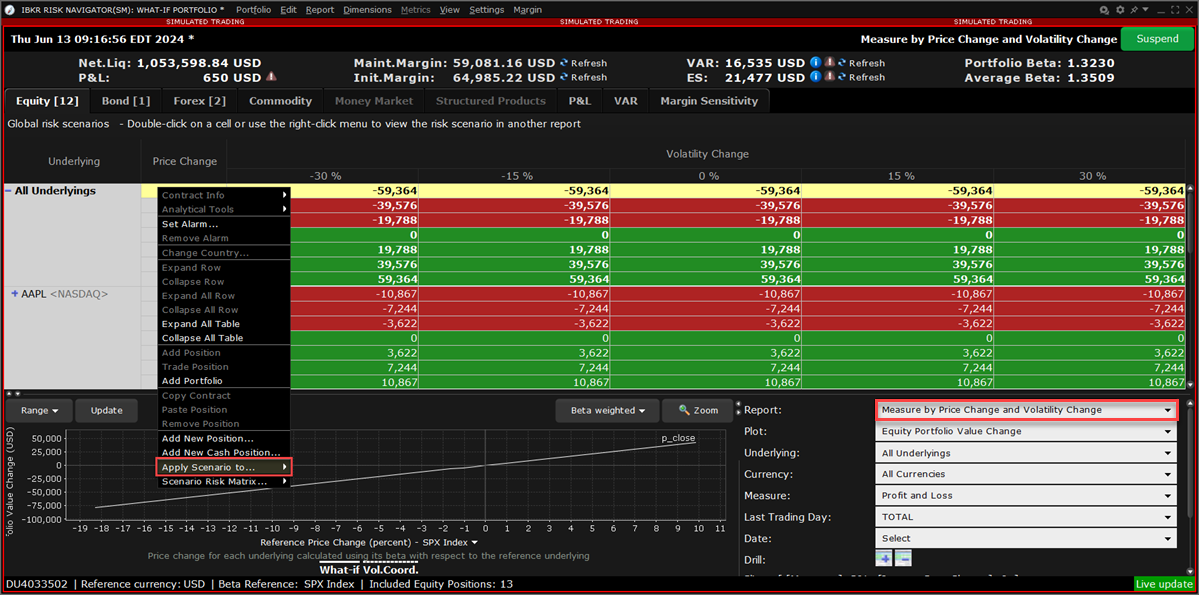
Select the Measure by Price Change and Volatility Change Report in the bottom right corner of your Risk Navigator screen.
-
Select a market outcome scenario by clicking in a cell at the intersection of the x-axis and y-axis scenarios.
-
Use the right-click menu to select Apply Scenario to, and then select a report.
-
The chosen report is displayed with the applied market outcome scenario you selected described at the top of the report.

When you are viewing the market outcome scenarios via the drill-through feature, all of the values on the report reflect this hypothetical scenario, and therefore do not reflect actual, real-time risk. To reset the report to real-time, click the Reset Scenario button on the top right.
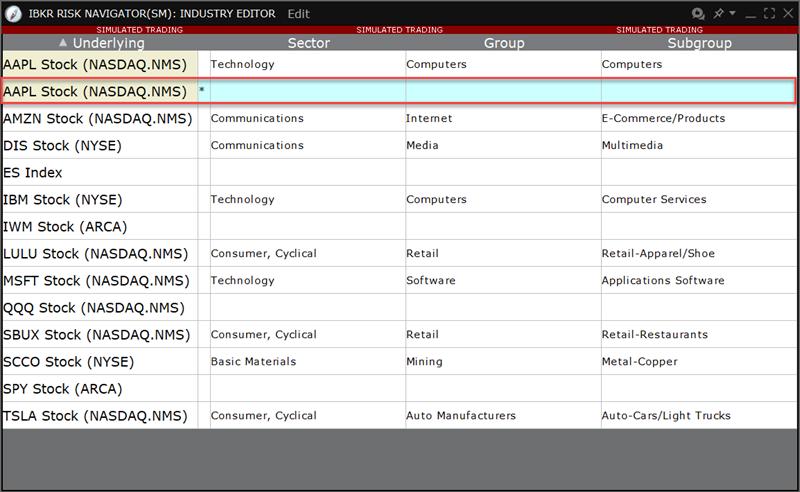
You can modify the default industry groups shown in the Risk by Industry report using the Industry Editor. The editor allows you to assign an underlying to a different group, assign the underlying to multiple industry groups, and create new industry sectors, groups and sub-groups.
To use the Industry Editor
-
From the Risk Navigator Edit menu select Edit industry groups. The Sector, Group and Subgroup fields become editable when you click in them.
-
An asterisk appears next to any underlying whose sector, group or subgroup have been edited.
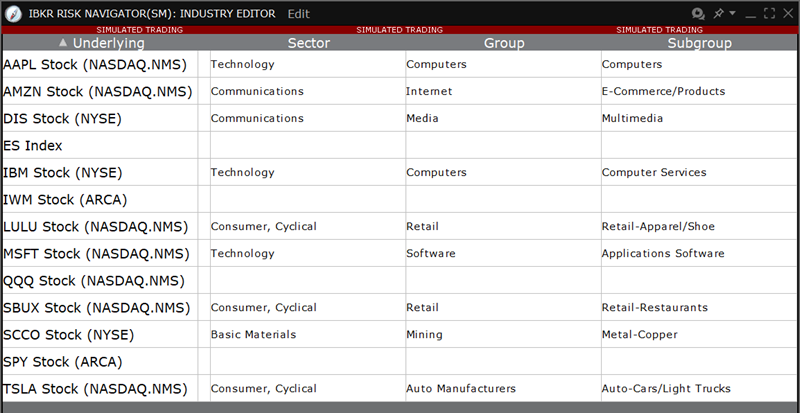
To assign an underlying to a different sector, group, or subgroup
-
Click the appropriate field in the underlying row and select a different entry.
To add the underlying to multiple groups
-
Use the Industry Editor Edit menu to select New Entry for Underlying. A second line is created for the underlying.
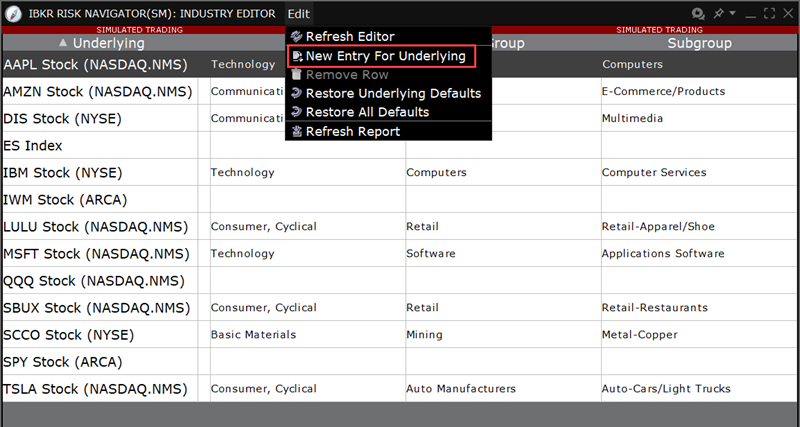
-
Click the appropriate field to display the drop-down list and select a different entry. You now have two lines for the underlying with two different industry selections.
